FYI: Data Mishaps Night is this week on the 24th! Register! Come and hear hilarious data stories from lots of awesome data folk! The speaker lineup is awesome! My full post on why it’s a cool event is here.

Earlier last week, I was in a bit of a mood, and made an innocent tweet about wanting people to do more data collection, and it unexpectedly went viral on me. (I also wrote about how data scientists need to go out and collect some data about 6 months ago.).

That in itself isn’t interesting. What’s interesting was that a bunch of people from all sorts of scientific fields started chiming in with examples from their particular fields, many of which I haven’t even thought to consider before. As many readers know, I love learning about other fields of study, so it was practically a week’s slow drip of drugs into my system. I didn’t feel it was fair to have all this fun myself, so I’ll be sharing a small sample with all of you this week.
How I approach watching other fields collect data
Many years ago, I asked a Scandinavian friend of mine who was a big NASCAR fan why he enjoyed it. Being a kid growing up in NYC to immigrant parents, I was about as far away from understanding that sport as humanly possible. My friend’s response was that the cars in NASCAR are so close to each other in terms of performance, the primary factor in deciding the fractions of a second needed to win came down to how much teamwork existed between the driver, pit crew, and race team — it was a team sport that merely appeared to be a simple car race of people steering left at 200mph.
That exchange opened my eyes to understanding a bit of a weird sport that I still don’t “get” but can at least now understand at an intellectual level. It also got me to notice more about how things can be very similar with just a tiny scratch under the surface.
Aside from being a giant nerd about data, my biggest reason for loving to learn how other fields collect and handle their data is because I have the belief that it might come in handy someday in the future. Every field and problem has their own unique sets of challenges associated with it, and very smart people have spent entire careers across potentially centuries refining ways to handle those challenges. Meanwhile, other fields and problems might wind up being similar enough that you can draw analogies and borrow techniques to help provide a fresh approach to the problem. Even if things aren’t a perfect match, it sure beats having to reinvent the wheel from scratch.
So under that backdrop, let’s use our imaginations a bit to explore and then dig abit into other fields!
Murder birds


First, let’s stop for a moment to think about raptors. Imagine you’re studying these big birds, sometimes apex predators of an ecosystem. They’re rare (some critically endangered), have huge territories and/or migrate with the seasons. They can also be nocturnal, like owls. Imagine that you want to estimate how many of them are in a given territory or country. How would you do it? They’ve got giant claws and beaks, and aren’t very likely to want to spend time with you to take your 5 minute survey.
As I got interested in the topic, I started around for some methods and found these two sources that seem fairly well cited: “Methods of Detecting and Counting Raptors: A Review” by Mark R. Fuller and James A. Mosher and also “Raptor Survey Techniques” by the same people. The two sources aren’t extremely long and can be an interesting skim. The most interesting parts for me was how there were many different surveying methods that were described to fit various constraints on running a study.
For example, one surveying method is called a transect, where observers travel along a given path (very often a road since then you can drive along it). The observers look to each side and count the various birds they can see along the path, yielding a number of birds found for a given distance traveled. That’s a raw piece of data, but there are important factors to consider, such as the road can’t follow certain geographic features like ridges because those features are likely to influence bird behavior. There’s also assumptions you have to make for deciding how the number of birds you’ve spotted relate to the “true population” of birds in the area.
Other methods involve things like counting nests or doing surveys from fixed observation spots. Other challenges include having observers trained to spot the species of birds in question (for example, I’m likely to be unable to tell a hawk from a pigeon at any useful distance).
Fishes!


Every go to an aquarium, see one of the giant display tanks just teaming with life, and go “Wow, that’s a lot of fish!”. Ever try to count how many were in the tank? How far did you even get before you gave up? That’s what got me all excited when I saw this response. How the heck do people do it out in the open oceans? I know that it’s critically important to understand the number of fish in a fishery to help maintain the health of the ecosystem, so people must be doing it.
When I asked what methods were being used, the reply came back as “Multi-frequency split beam sonar with concurrent net tows!”. I had no idea what that even meant, so I went searching and found many papers within the past 20 years of people applying variations of the technique for different species of fish.
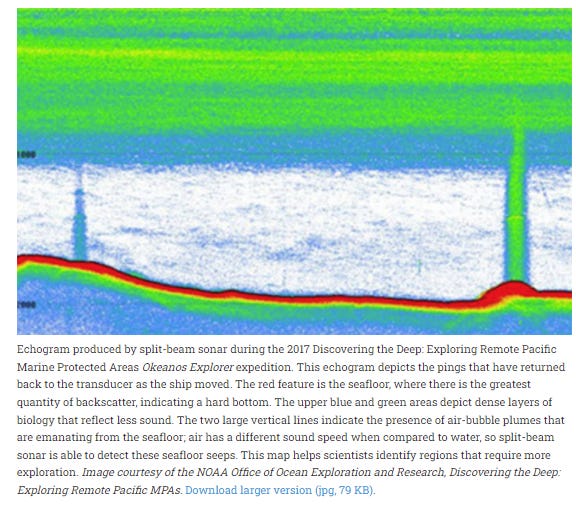
NOAA has a short page that explains what split beam sonar is. What I find fascinating is that sonar echograms aren’t really magical super-detailed images like in some magical sci-fi show. The page provides an example:
Aside from the bright red line indicating the sea floor, I can barely make any sense of it. All the green stuff near the top is supposed to be living things in the water column. So my rudimentary understanding is that you can understand roughly how deep the majority of the biological life is from the diagram. Then, with the help of nets that are cast to sample those depths, you can then get a rough sense of what kind of things are living in those depths.
Then you just have to repeat this process many many times, over many many miles of water, to get a map of what a fishery looks like.
Except fish and stuff move, right? I’m sure they’ve developed ways to account for things like that too.
Building materials


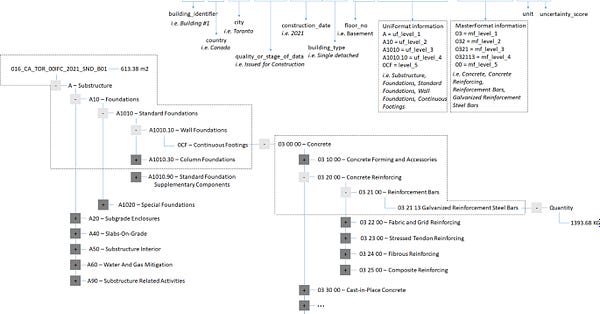
Ever look at a building and go “Wow, how much concrete and steel and screws went into that thing?” —wait, just me and a bunch of civil engineers? Well, I got linked to this cool study that built a dataset that tried to answer the question for 70 buildings in North America. Knowing how much material goes into constructing a single building is useful for things like planning ahead, forecasting materials needed, and understanding the ecological impact of construction.
The project also goes into more detail than merely figuring out how many tons of concrete, wood, etc. go into a given building. They break things down into whether a material was used for the substructure, superstructure, walls, roads, etc.. A good chunk of the project involved building out the data model needed to express all these concepts. The other part of the work involved getting plans of buildings to make estimates for, as well as using the construction plans to infer just how much of various materials were used in the construction of various features.
Biology and Biochemistry
Okay, this is less data collection and just something that someone linked to me that I found ridiculously amazing. Here’s a link to a GIANT MAP of cellular metabolic pathways. I haven’t looked at organic chemistry since high school over 20 years ago, so I don’t really understand any of it anymore. But I can still appreciate the massive amount of scientific work spanning centuries needed to culminate in such a huge diagram. If someone knows any stories about the data collection needed to even flesh out one tiny bit of a metabolic process, I’d love to know.
Heck, I’d love to know how people managed to figure out these were the reactions needed. Like, what is that process? Someone please point me in that direction or tell me!
Computer vision of very old Japanese
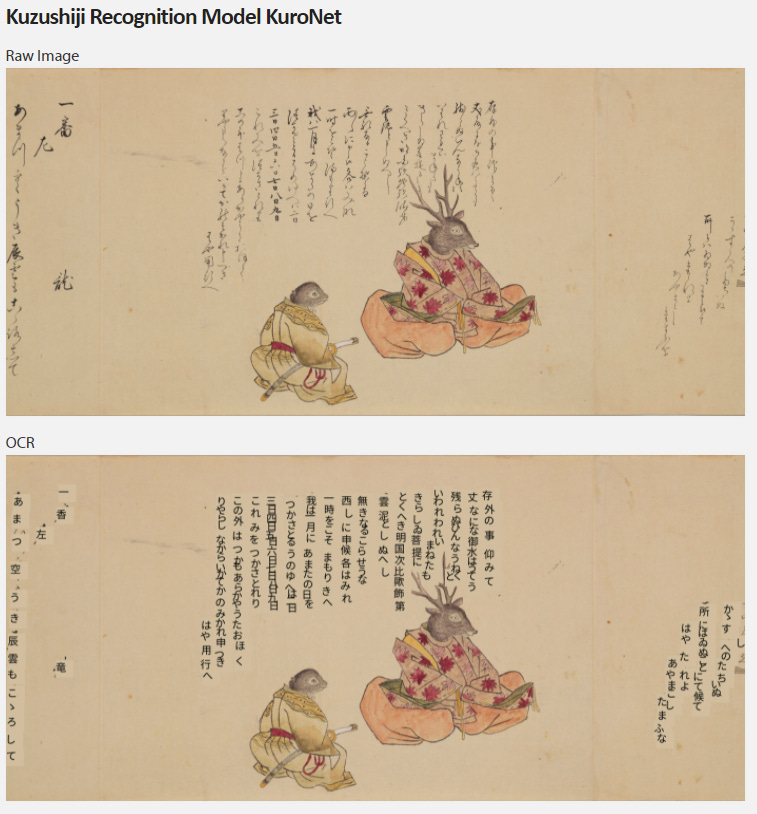
I’ve been a fan of this work by tkasasagi for years, ever since I saw it. It’s a computer vision recognition model that takes Kuzushiji, a form of writing of pre-modern Japanese (a.k.a. before the Meiji era language reforms that normalized the language to it’s current form around the 1920’s). Most Japanese people cannot read this type of script, though they might have old papers with it stored away in a box from their great grandparents.

What’s really fun about this is how tkasasagi published datasets for computer vision researchers to work with. She even made an app called “miwo” (android, iphone) that lets users use OCR on kuzushiji so that people can understand those mysterious papers sitting in storage.
Final observations
I only had time to poke my nose into just a handful data collection methods amongst all the comments and replies that I’ve gotten, so I’ll have to stop the showcase of fun examples for now.
One thing I did notice was that a very high proportion of responses came from… current PhD candidates. Which stands to reason because they’re in the middle of perhaps the most painful data collection project of their lives right now.
There was also a lot of positive response from a whole wide range of the sciences. Maybe I’m just reading a bit too much into it, but it could be a bit of venting from everyone against the whole “AI/ML is taking over the world!!!” narrative that’s been so hot of late. We’re all a bit tired of having to reference the “Here to Help [with algorithms]” xkcd.
After all, there’s more stories of AI failure than success when it comes to real world situations.
Still, if anyone ever wants to suggest I look into, or write about, some kind of counting or analysis method that’s in use by some scientific field out there, please let me know!
No one sent in anything for me to share/review this week. So if you have anything for next week, send them on over~
Standing offer: If you created something and would like me to review or share it w/ the data community — my mailbox and Twitter DMs are open.
About this newsletter
I’m Randy Au, currently a Quantitative UX researcher, former data analyst, and general-purpose data and tech nerd. Counting Stuff is a weekly data/tech newsletter about the less-than-sexy aspects about data science, UX research and tech. With excursions into other fun topics.
All photos/drawings used are taken/created by Randy unless otherwise noted.
Curated archive of evergreen posts can be found at randyau.com
Supporting this newsletter:
This newsletter is free, share it with your friends without guilt! But if you like the content and want to send some love, here’s some options:
Tweet me - Comments and questions are always welcome, they often inspire new posts
A small one-time donation at Ko-fi - Thanks to everyone who’s sent a small donation!
If shirts and swag are more your style there’s some here - There’s a plane w/ dots shirt available!


