

False Discovery Rates in A/B tests
False Discovery Rates in A/B tests
Wait, what?

Attention: As of January 2024, We have moved to counting-stuff.com. Subscribe there, not here on Substack, if you want to receive weekly posts.
First post of the New Year! Here’s hoping 2022 isn’t another 2020.

This is probably an ill omen, but I’m going to start the year off by reading an academic paper related to statistics again because the topic it covers is just too interesting not to.
Over the break, I came across this tweet and was intrigued.

The super short gist of it is that Ron Berman and Christophe Van den Bulte had published “False Discovery in A/B Testing” (link to paywall free version, I’ll be referring to various sections so might as well open it now). The TL;DR is that they used data from the online A/B testing platform Optimizely to examine and estimate the False Discovery Rate (FDR) within that particular testing ecosystem.
What’s FDR? At the simplest level, imagine the set of statistically significant effects found within an experimental context, e.g. all the A/B you’ve run on your site, the FDR is the percentage of all those significant effects where the alternative hypothesis that you accepted was ACTUALLY equal to the null hypothesis— they were false discovery. It’s the first cousin of the familiar α that we set that told us out of all possible experiment outcomes, what the chances we’d observe our particular outcome (or one more extreme).
Since I don’t know up from down in the statistical literature, I had never heard of FDR before, though Wikipedia mentions the concept was formally described by Benjamini and Hochberg in 1995. The method itself seems to have been developed due to the rise of genomics where a single experiment can generate thousands of statistical comparisons at once and a traditional Bonferroni correction would’ve created too many false negatives to be cost effective.
Within the paper, they reference three different methods to estimate the FDR given a bunch of experimental data. The math goes over my head, so feel free to check the paper out for those details. They go into the derivation of FDR, an explanation of the estimation methods.
More interesting to me and I think most other practitioners is the part where the authors apply the estimation method to Optimizely’s data to calculate an FDR for that context. Since they’re a giant vendor for online A/B tests for web sites, the experimental domain is extremely close to the one I’ve been working on for ages.
Looking at 2,766 experiments run on the Optimizely platform that fit certain criteria in 2014 (must have ended w/in the time window, n>= 100, using Engagement as goal, and others, see p.13 for details), they use the three estimation methods to get values of the probability that the true effect of a treatment as 67%, 80%, 72% depending on the method (π_0 in Table 6, p.13). That’s quite a horrifyingly huge number. But the authors mention this jives with other studies:
True nulls amounting to 70% of all effects may sound high, yet it is consistent with an earlier report that the true null rate in experiments conducted on Microsoft’s search engine Bing was over 80% (Deng 2015). Also, it compares favorably with academic psychology where the true null rate has been estimated to be about 90% (V. Johnson et al. 2017) (p.17)
To translate, that means out of all the tests examined, the null hypothesis was true and equal to the variant in 70% of all experiments. In general, people seem to be really bad at picking potential variants, often picking duds to test whether it’s because they’re risk adverse, or maybe testing 41 shades of blue.
But we don’t care too much about the pool of all possible variants, we have statistical significance to act as a guardrail, right? From here, the authors use π_0 to estimate the FDR at various significant levels. For the typical α = 0.05 we’re used to the various methods of estimating suggest that ~18% of significant results are false discoveries.

An FDR of 18% for website A/B tests conducted at α = 5% may seem surprisingly high. Yet, it compares favorably with FDRs for tests at the same level of significance in medical research which experts believe range between 20% and 50% (Benjamini and Hechtlinger 2013) and with FDRs in psychology where analyses of three different bodies of test results reported FDRs of 41%, 58% and 81% (Gronau et al. 2017). (p.18)
Side note: for length I’m glossing over a lot of details about the data set where the authors answer questions along the lines of ‘but were those experiments just run poorly, leading to this result?’, in short I find their reasoning in the “Robustness to Key Assumptions” (p.23) section they have on that front satisfactory enough to accept that they’re in the right ballpark.
While I was pretty surprised at the result, a little demon inside me wasn’t
Having spent over 12 years doing product work on web sites and running experiments large and small, there was always a tiny little part of me that had doubts about what was going on with A/B testing.
Imagine this scenario: You’re at a company and ran 5 experiments in the year that had statistically significant effects, and the effect sizes weren’t trivial. Each experiment was independent and gave a healthy +5% increase in your company’s favorite metric — let’s say revenue. You do your very best to run the experiment correctly, no peeking, healthy sample sizes, you even checked the random assignment and telemetry to make sure no bugs screwed things up, the team launches all the changes with great fanfare each time. So far things look good.
Then, 6 months later, the CEO, whatever casually strolls up and goes, “Great work on those experiments being wins. We had five +5% revenue launches this year, but at the end of the year we were only +4% year-on-year overall. That’s too low even factoring they didn’t run all year. Can you look into what happened?”
Panic time. Because I’ll be damned if I have an answer as to why that happened.
Maybe the +25% total effect exists and we just have to wait a year to see. Maybe the present looks different from the past. Maybe we launched a couple of other dud experiments that counterbalanced things. Maybe a competitor did something, maybe a pandemic happened, maybe the balance of new/returning users shifted. Maybe users got used to our changes, or the true effect size was smaller than expected, or only worked on a certain segment, or the different tests interacted in some way that changed the overall outcome. I dunno.
I’m good at analyzing data, so I have a ton of tools in my toolbox to check almost all those things and more from the list above — using historic data, projections, analysis of traffic. It might take a ton of time and a lot of dead ends, but I can probably assign blame to something(s) if I really really tried.
Or maybe, some of those +5% wins were fake. That’s one thing I can’t answer by re-analyzing existing data. I’d have to do something expensive drastic like run a replication experiment. Given how p-values are defined and how we use them, there’s no other way to tell if you’re sitting on that branch of the multiverse of “the 5% chance it just happened due to random chance”.
I’ve had this sort of exchange multiple times in my career, and while I never had the term FDR to express it, it was always there lurking in the darker corners of my mind. That’s why I latched onto this paper over the weekend, the nameless demon finally had a name.
So what can be done to improve FDR?
Starting in the Results section on p.18 and more directly on p.28, the authors start going into looking into various ways to manage FDR.
“Easier” changes, mess with sample size and α
First, from Table 7 above, you can see one way to deal with FDR is to use much stricter criteria for significance. FDR drops quite a bit if for α = 0.01 and α = 0.001. But think about all the failed experiments you’d have demanding such a tight p-value bar. Consider how demoralizing it can be for an engineering team to build and test multiple prototypes only to have most of them thrown away, especially when some might actually be real positive changes.
The authors also include a brief check asking if FDR would decrease if we had more statistical power, and their answer is no, even with a statistical power of 100% from a giant sample size, the FDRs are still pretty large. Instead they blame the large value of FDR on π_0, the probability that a given variant would have no difference from the null hypothesis. Still, you can increase your sample size (and thus power) to help the situation a bit.
They helpfully provide a table to show the relationship between power and significance level, so you can calculate both and figure out what your FDR is (assuming you’re working in a web site A/B testing space where π_0 = 72%)

Two-step testing
Next up in difficulty is running two tests to verify that an effect “is real”. While you can do a straight up replication, it would cost double the amount of time to run (which is generally undesirable in industry). So they also suggest/reference some ways to squeeze more efficiency using different some more complex setups on p.13 .
A “Just pick the best” testing strategy
This one was interesting, what if you didn’t bother with significance testing and just “picked the best variant”? In a straight vanilla A/B test, your FDR would be the same as π_0, but as you increase the number of variants, the authors found with simulation that the results start approaching (but never beating) the traditional A/B and two-step A/B tests.
Not sure if I’d ever sell be able to sell a manager this but something to ponder on because it might come in handy unexpectedly someday.
This does raise interesting thoughts about why people who know nothing about statistical inference but just “do what works” can still be successful.
Get better at experimenting
So far, we’ve covered two model parameters (α and sample size), but there’s actually 5 model parameters that feed into FDR.
… identifying candidate interventions that are less likely to be true nulls and that are larger given that they are not null, which implies (iii) decreasing π_0, (iv) shifting µ away from zero, or (v) increasing the variance of true effects σ^2 . Note, shifting µ and σ away from zero increases the odds of having a large true effect and hence also boosts the power of the test.
…
Changing π0, µ and σ requires changing the quality of the interventions being generated. That may be difficult to achieve directly (p.28)
The authors very politely refrain from saying “Git Gud at testing”. There’s probably epistemological limits on how good we can get too.
Table 12 lists out the model parameters in a sensitivity analysis for their analysis of FDR, and you can see that the “easy” levers discussed already have pretty small (but noticeable) effects on FDR.
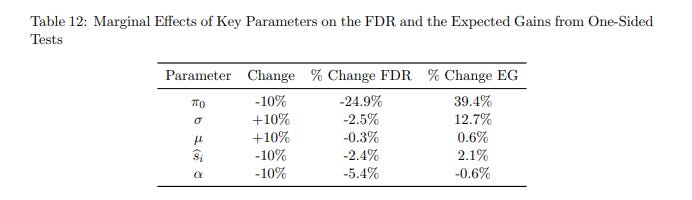
Meanwhile, I think every practitioner out there who’s ever run a regression is itching to figure out if they can find a way to tweak π_0. If we can just have less variants that are equal to null, we’d be much better off!!!
I don’t personally have an answer to π_0, but I do typically advocate for something that tries to put some constraints on it.
I like testing with sledgehammers
Back in my Communications methods courses, while we were learning how to design experiments, one thing popped up consistently. All the students wanted to run “ecologically valid” experiments instead of “contrived lab experiments”, and they very often criticized studies for being done in labs where it’s not clear if an effect would translate out into the real world.
But over time, our professor tried to impress upon us the idea that the effects we measured were tiny, and a non-lab study would have lots of (statistical) trouble replicating a tiny effect size, even if the same effect had been robustly replicated in multiple lab settings.
There’s an “natural” order to experimentation, you want to first smack subjects with a ridiculously strong treatment to prove that any effect exists to begin with. When you come out strong, you have less doubts about whether subjects noticed, understood, experienced the treatment correctly. Only once you’re sure that something exists do you start targeting more complex and subtle setups. As you refine down things become increasingly difficult to measure and find.
I try to advocate for a similar approach to experiment designs at work. If a user deliberately doesn’t click the giant blinking button taking up 50% of their screen, they’ll likely never click it at a normal size. If no one understands the design during a user testing session, no few will understand it in the A/B test.
Don’t waste time running those badly designed experiments. Incorporate your experiments into a full research program that tries to tease out generalizable concepts (like learning whether people prefer knowing the price up front or not) that can guide your experiments down the line.
This should put some bounds on π_0 in at least some dimensions compared to the broad population at Optimizely (which will always have a mix of users of different skill levels). FDR can still go wild in other directions, especially when we have to chase tiny effect sizes, but this pushes the problem further down the road.
Since I work on a UX team as a Quantitative UX Researcher, and work very closely with qualitative researchers and designers, we do spend time making sure things are designed well so that we have some belief that an experiment we run has a chance at doing better than the control. They still fail pretty often, but we’re not testing obviously ridiculous things.
I’m sure that readers out there have their own mechanisms and best practices for preventing “obviously bad experiments” from even going out the door, and I’d love to hear them.
About this newsletter
I’m Randy Au, currently a Quantitative UX researcher, former data analyst, and general-purpose data and tech nerd. The Counting Stuff newsletter is a weekly data/tech blog about the less-than-sexy aspects about data science, UX research and tech. With occasional excursions into other fun topics.
All photos/drawings used are taken/created by Randy unless otherwise noted.
Curated archive of evergreen posts can be found at randyau.com
Supporting this newsletter:
This newsletter is free, share it with your friends without guilt! But if you like the content and want to send some love, here’s some options:
Tweet me - Comments and questions are always welcome, they often inspire new posts
A small one-time donation at Ko-fi - Thanks to everyone who’s supported me!!! <3
If shirts and swag are more your style there’s some here - There’s a plane w/ dots shirt available!
Question. I read this statement:
- I’d have to do something expensive drastic like run a replication experiment. Given how p-values are defined and how we use them, there’s no other way to tell if you’re sitting on that branch of the multiverse of “the 5% chance it just happened due to random chance”
I've read some research papers on degradation of service experiments, rather than an replication experiment. Could you/have you do one of those, to test a feature here?
This was outstanding. Recommended it to several product communities.