

It's Goodhart's Law again
It's Goodhart's Law again
For a certain class of problems


The great thing about Twitter is that while I’m not an academic of any sort, I can participate in conversations with people who are, about interesting topics, and there’s lots of learning all around.
This week, we’re going to return to a perennial topic for data scientists, Goodhart’s Law — the observation that “When a measure becomes a target, it ceases to be a good measure.” Effectively, the metrics we use to describe the world can become distorted once we start trying to change them, often in bad ways.
When a large part of some data scientist’s job winds up being doing the background research and figuring out what the “correct” metrics are for entire teams and organizations, we always have to keep Goodhart in mind. These metrics can guide an entire company and in the absolute worst case, lead to a massive waste of energy and resources chasing a flawed moonbeam. The more we can anticipate (and head off) situations where individuals game a metrics system in a way that leads to negative consequences, the better.
So a couple of days ago, another academic chimed in on an old thread I Was in about Goodhart’s Law with a paper, “Strategic Classification is Causal Modeling in Disguise” (Miller, Milli, Hardt 2019).

This paper is sets up the situation as this: we want to design a set of incentives to induce desired changes to a system. Then they do a couple of interesting things.
First, it models the problem as an interaction between two actors. There’s of course the incentive-setting actor that’s trying to manipulate a metric — for example, an HR department that wants better hires might start using Github contribution volume as a proxy for software developer quality (don’t do this). The metric is then the basis for an intervention of some sort, an effort to attempt to shift behavior. In this case, the incentive-setter is going to influence their hiring based on that metric, perhaps by making Github contributions prominent on postings, etc. (again, don’t do this, it does not end well).
On the other side of the situation, there’s the individual actors that are affected by the metric — in this case individual software developers who are having their Github contributions judged. They’re playing by the rules that are handed down from the powers that be but have control over their own behavior. In this situation, they can choose to put energy into their Github accounts, or not. In theory they will be rewarded with jobs and pay increases based on the metric set by the incentive-setter.
The paper also makes a distinction between “Improvement” and “Gaming”, in that any intervention is aimed at shifting actors within the system an “improvement” is the desirable, intended, results and “gaming” are the undesirable, unintended results. Both are just the result of actors responding to the incentives given, and it’s really the direction and intended use that distinguishes the two.
With the basic situation described, the rest of the paper than talks about causal graphs, and how the incentive-setting actor is actually (whether they know it or not) trying to make a causal argument when they set an incentive.
The argument roughly runs like this in non-mathy terms (because I don’t have the training to fully parse the symbolic argument):
Imagine a simple causal graph:
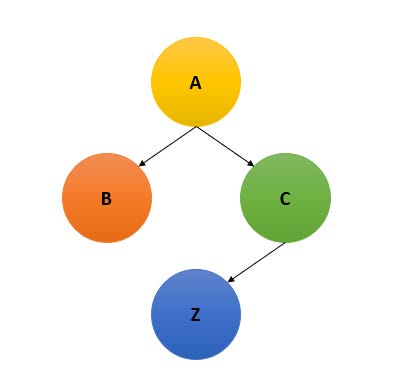

A has an effect on B and C, (aka, a change in A causes changes in B and C).
C is the only node that has an effect on Z
In the above graph, Z is our intended result for the system, let’s say it’s # of contributors making contributions to open source projects
A is our intervention, it causes independent actors to make choices B and C. Here, let our intervention be give T-shirts to people who submit (4+) pull requests to any public repository on Github.
Choices B and C are a simplification of all the possible choices that actors can take. In this case, C would be “submit a useful pull request” and B is “submit any ol’ pull request”. You can imagine many other parallel nodes, such as “make low-effort repositories to PR against”, etc.
If this situation sounds vaguely familiar to you, that’s because I just described the 2020 Hacktoberfest debacle hosted by Digital Ocean. The company was going to send T-shirts to people who contribute to open source projects (well, public Github repos). While spam had always apparently been an issue with the event, it ratcheted up even more when someone with some social media presence showed their followers how to make low-effort PRs. A race to the bottom ensued and the open source community essentially got spammed with thousands of crappy PRs that buried already overworked project maintainers.
It’s a pretty public example of a marketing stunt with incentives gone horribly wrong, because there’s enough people on the internet willing to do ridiculous things to get a free widget that it inevitably becomes a problem.
The importance of understanding causality
The authors of the paper make the argument that the whole “making incentives” problem is one involving understanding and managing causal graphs. Essentially, in our simple graph, the incentive-setter has one goal — increase behavior Z. To increase Z, they need to understand that changing C is the only way to cause changes to Z. From their, they need to design the incentive A, such that it causes people to adopt the behavior C, thus increasing Z.
When the incentive-setter doesn’t understand the causal graph well enough, you get Goodhart’s Law. Incentive A actually winds up opening a whole host of possible choices, B, C, and others. The cost associated with taking the undesirable action B (submit a spam PR) is significantly less than taking the intended action C. Since, by definition, B has no causal relationship to Z any actor that takes that action adds disruption to the system. It having a lower cost to entry means that actors out to minimize their own costs will dogpile on the cheaper, undesirable, action.
So my read on this is that Goodhart’s Law boils down to the fact that we humans rarely have a solid understanding of the causal graph for most real-world situations, especially when it applies to the endless variation of human behavior. IF we had omniscient ability to see all the relationships between incentives and actors, then of course we’d be able to craft incentives that can prevent gaming. That’s why it always feels so darned difficult to do it correctly.
Also note that I also just used an extremely simple causal graph to illustrate the basics, but you can easily have situations where there there are negative effects that are causally connected to our desired positive effects, or other messy situations. Sometimes the world itself conspires against our best efforts.
But wait, there’s more (despair)
As the conversation went on, David Manheim, who spent way more time thinking (and publishing) about issues around Goodhart’s Law than I ever have, reminded me that there are multiple classes of the problem — not fully understanding relevant causal relationships is just merely one of them.


While I’ll save the topic for another day, there are other ways for our metrics to stop becoming good metrics after they’re made into targets. These include:
Having a metric that isn’t perfectly in line with your goal, so they diverge at the long tail
Or your metric was fine until you hit new extreme values you’ve never seen before and it’s not good any more
Or you’ve got actors that want to manipulate your metric and incentives to their own ends
Or your incentive worked and everyone shifted their behavior… which shifted the causal landscape so much that your model and metric don’t hold anymore.
And so on…
So yeah. We’re going to be dealing with lots of flavors of this problem throughout our lives because I don’t think there’s easy ways to solve most of them.
But hey, at least take comfort that when you’re trying to set a good metric and it feels like you’re trying to predict the future and it feels really hard?
Well, it actually is.
About this newsletter
I’m Randy Au, currently a Quantitative UX researcher, former data analyst, and general-purpose data and tech nerd. The Counting Stuff newsletter is a weekly data/tech blog about the less-than-sexy aspects about data science, UX research and tech. With occasional excursions into other fun topics.
All photos/drawings used are taken/created by Randy unless otherwise noted.
Supporting this newsletter:
This newsletter is free, share it with your friends without guilt! But if you like the content and want to send some love, here’s some options:
Tweet me - Comments and questions are always welcome, they often inspire new posts