Attention: As of January 2024, We have moved to counting-stuff.com. Subscribe there, not here on Substack, if you want to receive weekly posts.
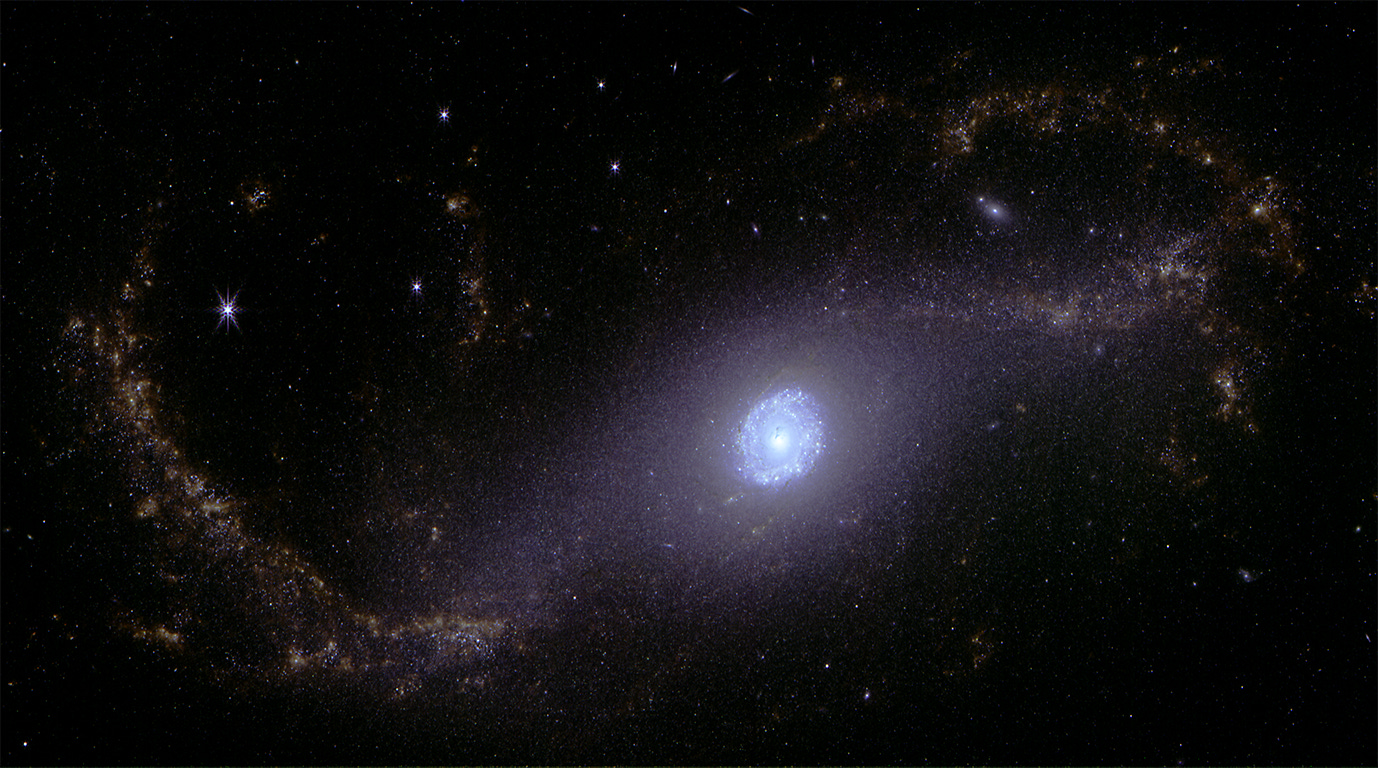
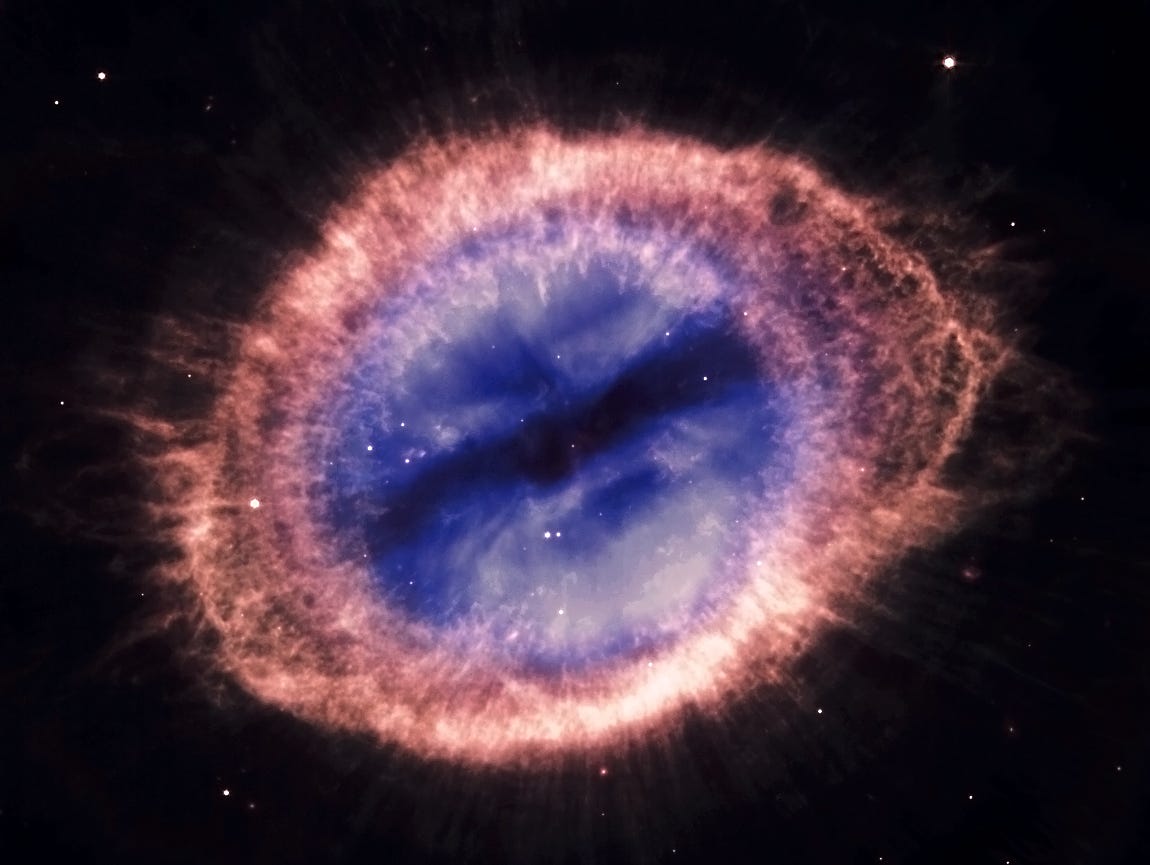
Pictures are just numbers on big grids, right? That’s data so it’s relevant to this newsletter, right? Well, buckle up because over the weekend I came across an article about how to process JWST (and other big telescope) images on our own computers! I certainly wasn’t going to pass up a chance to play with data from outer space and then share it with y’all.
I’m pretty sure that most readers out there aren’t astronomers, so we aren’t familiar with taking data from telescopes and then turning them into pretty pictures. So hopefully by the end of this, I can inspire you to give it a try too.
You’ll need some software to start, SAOImage DS9 is apparently a tool commonly used by astronomers to view the FITS files that’s the standard for telescopes both small and large. If you’re familiar w/ photography cameras, it acts much like a RAW file converter, but with significantly more manual knobs and potential science uses. There are other FITS processors and libraries also available to try, I just happened to use DS9 for now. It might not even be ideal for this use case but it got me started.
Next, we’re going to need telescope data. The Mikulski Archive for Space Telescopes (MAST) is an archive for data from a bunch of major telescopes, including the JWST and Hubble (HST) missions. It allows for anonymous users like you and me to download data — for free! You only need an account to access data that’s currently under exclusive access/proprietary restrictions. But remember that we’re just nerds having fun so don’t slam the servers that professional astronomers are using for doing real science work. Also remember to credit the Principle Investigator, telescope and other relevant bodies for their work.
When you head to the portal, pop open the advanced search parameters in a link near the top center of the page. From there you can filter down what you want. I used the following parameters for mine that yielded 44,753 records as of 2023-10-06:
Observation type: science
Mission: JWST
Data Rights: PUBLIC
Product Type: image
Tip: Some fields like “Target Classification” you need to type in text to match. You can use * as a wildcard to match for things like *nebula* etc.
Tell the site to search with those parameters and once it gets results will allow you to further filter out stuff on the left UI. Under Provenance Name: filtering out “APT” seems to drop most of the observation proposals that haven’t collected data yet. From there, you can sort around and see what objects have been put up for download.
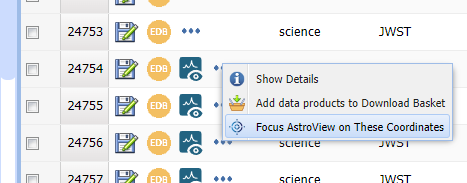
If you choose “Focus Astroview on these coordinates” from the 3-dot menu, the right panel will jump to show the patch of sky the observation is aimed at. Once the search is done loading, it will also put boxes to represent various observations. You can click on the boxes to highlight the specific observations you’re interested in. It makes locating a good framing of your target much easier.
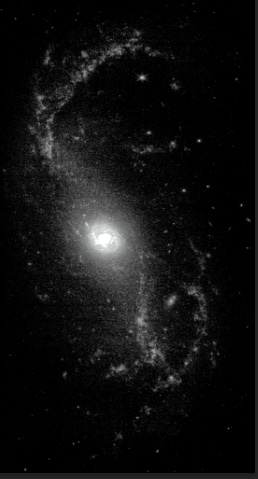
Once you home in on the data you want, you’ll want to make note of the details of the files. “Show Details” in the 3-dot menu will give you a very important preview of the data in the observation. A lot of images are of things that probably aren’t interesting to us, and this will save you time in finding an image to work on. It also gives you important credits information that you’ll want to keep to properly credit in your images.
The ones I randomly chose to play with today was this one:
Collection: JWST
Instrument: NIRCAM/IMAGE
Filters: F360MObs
ID: jw02107-o026_t008_nircam_clear-f360m
Exposure Time: 858.944 (s)
Proposal PI: Lee, Janice
Proposal ID: 2107
You can download individual data using the disk icon, but if you select multiple ones in checkbox you use the “Add data products to Download Basket” button to get up to 50GB worth of data at once in giant zip files. By default the files are named by the timestamp that you download the files, so make sure to rename things to stay organized. Normally you’re going to want multiple images of the same target at with different filters since each filter typically captures slightly different details due to the different light frequencies they help record.
Once downloaded and unzipped, you’ll find lots of small files. We’re going to ignore those and aim for the large FITS files inside. Use SAOImageDS9 to open the largest file in there.
The file loads at 1:1 pixel zoom, so usually you’re zoomed deep into the image by default. You’ll likely want to use the mouse wheel or menu to scroll out and fit the whole image into the display.
DS9’s UI is very quirky and centers around the rows of buttons above the image under the bulky grid of information describing what your cursor is floating over. The menus largely rehash those the main buttons, but also have as extra functionality to explore at your leisure.
You’ll first want to play with the “SCALE” button. This lets you play with the scale that maps the pixel data values to colors. Clicking the button will let you select in the second button row a bunch of functions that map the camera data to black/white values. Play with them a bit to see what looks good for your image. If you click the right mouse button on the image, you can drag left/right on the image to set the “bias”, the point where it start transitioning black to white. If you drag up/down on the image in the same way, you set the “contrast” parameter which serves to tweak how quickly values go from black to white. Be careful with right clicks in the program because you might get it perfect and then accidentally destroy your work with a stray right click. I also can’t find an undo function to use if you do that.
There’s usually very narrow sweet spot that’s different for every image that lets you see what you want without excessive light or dark points. You really have to experiment and tweak things.
Making COLOR is complex
So, each FITS file is essentially a raw file of pixel data. Unlike RGB color images, there is only one channel — effectively a giant grid of brightness values. To get color out of these data values, you would have to either use false coloring (using the color palettes provided in the color menu), or you would have to build an RGB image by setting frames to be the red/green/blue channels.
If you pay attention to the data you’re examining, it’ll have strings like “F335M” in it. That indicates which filter was being used to make that file since, unlike our phone cameras, astronomers have a single big light sensor and pop various filters in front of it to isolate specific chucks of spectrum. These filters of course are vary by telescope, and the only way to understand them is to read the JWST user manual. Yes, we can look at the user manual for a $10 billion piece of hardware floating beyond the moon. So cool.
After lots of playing around, I found that you can create a New RGB Frame in the tool. That pops up a little helper window that lets you manipulate RGB frames as “current”, much like Photoshop layers. You can set a channel as current and then open a FITS file to associate that file with the selected color channel. Associate three FITS files (even the same file three times works) with the three channels and you can individually tweak them to be your RGB channels.
One thing to note is that all the FITS files I played with happened to have World Coordinate System (WCS) information embedded, which correctly places the image against the celestial sphere. That’s largely why you can load multiple files and they’ll align up properly without the need to do anything.
One super unintuitive thing is the “Lock” menu entry in the RGB submenu. In Photoshop lingo, this LINKS the channels together so that changes in one affect all the images. This is important for stuff like cropping.
In my test, I downloaded the same target, at 3 different wavelengths filters, and associated each with a different color. Once you have your data imported, you’re going to need manipulate each channel by hand to blend it into an image. It can get extremely fussy until you have a hang for the controls. I’ve also learned that under Color → Colormap Parameters gives you fine grained control over that slider bar at the bottom that you could drag with the right mouse button. This lets you adjust the levels better. That said DS9’s image processing in the main workspace is workable but not really enough to get the best quality images.
Plus to throw a wrench in my plans, I kept hitting a problem trying to export to PNG where it complains the channels must be of the same size. I’ve tried cropping and all sorts of things to work around it, but thus far haven’t found a solution yet. It’s possible the 3 separate files I used just are different dimensions and it wouldn’t be a problem if I had exactly the same dimensioned files. Using the same file for all RGB channels actually worked, but visually it’s not as interesting since all the pixels overlap exactly.
A helpful person on Mastodon suggested that the FITS dimensions being off is like the cause and DS9 doesn’t do that kind of data cropping needed to fix it. Something like image reprojection with Python would be needed to get things to work. That’s more coding than I want to bother with right now so I went and tried doing things the hard way.
Color, the hard way
So what to do if DS9 just won’t play nicely? We do it manually with the power of Photoshop (or GIMP). The rough plan is this:
Load individual FITS files for each wavelength into DS9 and then export to PNG
Open up all the PNGs into Photoshop, align them using the stars as point guides
Fill in any centers of stars that are black because the brightness blew out the pixels
Use the “Colorize” function of Hue/Saturation adjustments to cover the individual layers Red, Green and Blue, plus a greyscale one for raw luminance data
Blend all the layers together using Screen blending mode to start
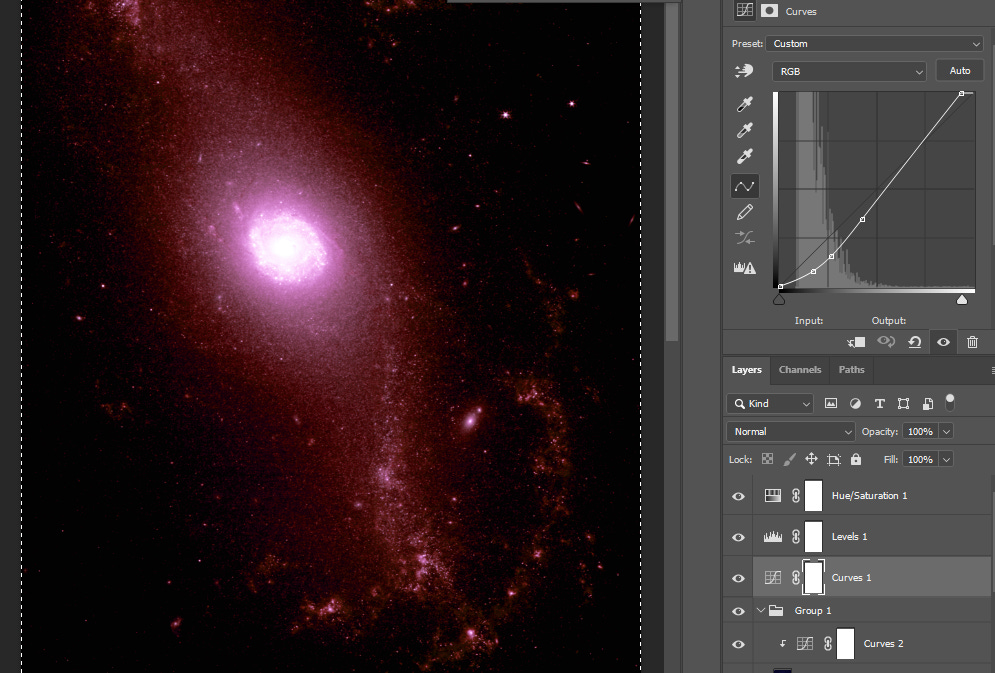
Manually tweak the levels, curves, opacity of various channels until I get the look I want. This is 99.9% vibes.
Reduce noise, sharpen edges, do things to make the image “pop”
Export that final image
Savvy astrophotographers will know that there’s software that does image aligning and stacking, like DeepSkyStacker, and in theory if you have enough observation data over time you can definitely do this to boost the signal to noise ratio of the final images. All my data were taken close together and with different filters so it wasn’t needed.
It’s a giant pain in the butt to do it this way, and I haven’t quite figured out how to get the colors to do exactly what I want yet. But I have many many more years experience using Photoshop and developing photos from my DSLR, so it’s slow but manageable. It also gives me access to the wealth of tools for sharpening, noise control, and blending that DS9 just doesn’t come close to reproducing
After playing with it a lot, I learned that if you take an hue/saturation adjustment layer in Photoshop and apply it against the layers, you can colorize them to RGB fairly easily. The trick is you need to balance the strength of the colors until they look about right-ish. By default if everything is max saturation and lightness, it’ll usually have a distinct tint. While you could tweak the hue to balance things, it’s much easier to tweak the saturation and lightness levels until the tinting calms down.
Now, if I was more sophisticated and science minded, I’d actually try to figure out what the filter wavelengths may correlate with and give each one a different color to composite up. At the very least, I might have at least put the shorter wavelengths bluer than the longer wavelengths. But since I don’t have this knowledge, I mostly did this by gut feel with my photography experience.
So there you have it, a way to download data beamed down to Earth from a bunch of giant telescopes. Getting pretty pictures out of it can take a significant amount of work. A couple of hours tinkering let me get something out, but I have a bunch of issues that I’m not satisfied with. I don’t have good control over the colors, there’s not enough color variation, I’m not getting the contrast and detail I’d love, I don’t understand what the filters are, I don’t really know how to work with the FITS files to any degree other than blindly exporting them. If I want to get satisfactory at this, there’s a lot more work to be done.
But at least it’s fun and pretty work.
Standing offer: If you created something and would like me to review or share it w/ the data community — just email me by replying to the newsletter emails.
Guest posts: If you’re interested in writing something a data-related post to either show off work, share an experience, or need help coming up with a topic, please contact me. You don’t need any special credentials or credibility to do so.
About this newsletter
I’m Randy Au, Quantitative UX researcher, former data analyst, and general-purpose data and tech nerd. Counting Stuff is a weekly newsletter about the less-than-sexy aspects of data science, UX research and tech. With some excursions into other fun topics.
All photos/drawings used are taken/created by Randy unless otherwise credited.
randyau.com — Curated archive of evergreen posts.
Approaching Significance Discord —where data folk hang out and can talk a bit about data, and a bit about everything else. Randy moderates the discord. We keep a chill vibe.
Support the newsletter:
This newsletter is free and will continue to stay that way every Tuesday, share it with your friends without guilt! But if you like the content and want to send some love, here’s some options:
Share posts with other people
Consider a paid Substack subscription or a small one-time Ko-fi donation
Get merch! If shirts and stickers are more your style — There’s a survivorship bias shirt!


