

Challenge: Predicting [Lunar] Eclipses
Challenge: Predicting [Lunar] Eclipses
Doing things the incorrect way, for science(?)

It’s 2021! We did made it!
Hopefully the year wont prove to be “2020 season 5”. To start the year off, I’m trying out a fun idea that had latched onto my brain over a fair amount of time that the holiday break has given me a chance to explore.
As a nerdy kid I consumed the usual mix of fantasy, sci-fi, and hard science in my formative years. One very common trope that pops up is the use of eclipses, usually of the solar variety, as plot devices. It was always taken something as a given that “ancient civilizations watched the sky and figured out how to predict eclipses”. The details were always just left as an exercise to the reader.
But… did they? And even if they did, how did they go about it?
Those questions always lurked in the back of my mind until over the holiday season when I was idly surfing YouTube (specifically, I bumped on this and this). There I learned about the Saros cycles — “a period of 6585.3211 days (14 common years + 4 leap years + 11.321 days, or 13 common years + 5 leap years + 10.321 days), is useful for predicting the times at which nearly identical eclipses will occur.“ (from Wikipedia).
Long story short, yes, eclipses ARE very cyclical and thus predictable, especially lunar ones. So long as you have enough data collected. Data collection is easier because an eclipsed moon is visible from half the earth at a time — the night side.
Solar eclipses are significantly more difficult to predict because the eclipse path is a tiny fraction of the earth’s surface, so the odds of seeing an eclipse in the same geographic location even twice is extremely low. Ultimately it took developing a refined enough understanding of the relative movements of the Earth, Sun, and Moon and knowledge of the shadow cast by the moon to make solar eclipse predictions. This stack thread has a lot of references to older civilizations that supposedly predicted eclipses to some degree or other.
But you don’t need (nor want) me to lecture you about the various cycles of the Sun and Moon. I barely understand any of this myself, so I’m not qualified tod o so.
HOWEVER, while pondering this, I realized that the whole process proves to be a very interesting data science challenge problem.
Predicting Lunar Eclipses (poorly) as a Data Science challenge problem
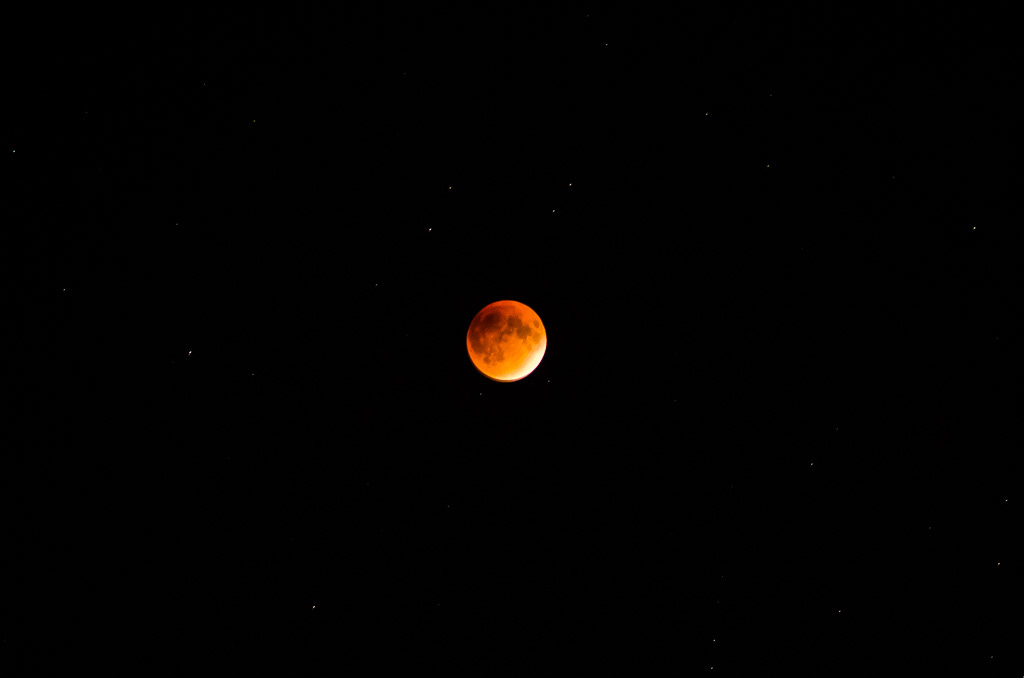
Imagine that we’re in a very weird parallel universe where we have all the space-age tech we use today… BUT we don’t understand the motions of the objects in the solar system. We’ve been asked to look at the records of all the horrifying lunar eclipse events that have been observed from our home city and try to predict them in the future. (We’re going to leave doing Solar eclipses for another series).
Could we, as people who know nothing about astronomy, accomplish such a task? This sounds like the crazy data problem that we get dropped into in our day-to-day work.
But this challenge is also better than real-life:
We know there’s a right answer — We have many historical documents that say ancient civilizations all the way back to the Babylonians have been able to do this to varying degrees of accuracy, we’re merely trying to retrace their footsteps
We can check our work — There’s tools that can generate a list of every single lunar eclipse visible from Earth, our “answer key”. (We’ll get to this later.)
We know from reading that eclipses are cyclic and somewhat predictable
There are also very interesting challenges:
While there is 1 true list of “all lunar eclipses visible from Earth”, it only applies if 1) you’re on the night side of Earth when it happens, and 2) the weather cooperates. We’re working with a data set that has ~50% (or more if you want to model weather) of the data is not visible.
It’s not clear how much data is needed to make a prediction. Supposedly the ancients did it with less than a thousand years of records like we’re going to have.
So, how would we embark on this wild goose chase?
The Plan (for doing it wrongly =) )
To do this project, we first need to have a list of eclipses that are visible to some spot on the Earth. That’s… not easy to do. But searching around for eclipse calculation code, I found that a Python package named Skyfield actually does offer the functionality!
I barely understand any of the features that Skyfield offers, but it uses Ephemerides data provided by NASA’s Jet Propulsion Laboratory (JPL), which gives the positions of solar system objects to calculate where stuff is. Either way, using the tutorial guides, we can calculate all the lunar eclipses that will ever happen within the time boundaries of the ephemerides data. Great.
Skyfield also lets you calculate how high in the sky an object (say, the Moon) is, from a certain point on Earth, on a certain time. Using this, we can figure out if eclipse is above the horizon over our chosen location.
Put those two together and we can generate a data set. In my case, I generated all the lunar eclipses from the year 1550 until 2640 that are visible* in NYC. I then dumped this out into a CSV file. I figure in the analysis step I can always use the eclipses in the far future as my validation set.
I also generated an “answer key” set that just has every lunar eclipse in that same period, regardless of whether the eclipse was above the horizon or not.
After this, I’ll load the CSV and… see if I can figure out how to predict things.
*Visible in this context is a bit subjective, just “> 0 degrees altitude for the observer and NOT a pemumbral eclipse which may not be discernible to the naked eye in various conditions.”. And of course there’s random weather concerns.
Let’s be clear here, this is the absolute worst case scenario for doing data analysis — we’re airdropping ourselves into a complex system knowing absolutely nothing about it other than a table of observations.
An actual predictive method would look at the system and mechanism that creates the observations and figure things out from there. It’d take into account that a full moon occurs once every ~29 days (length of the synodic month), and the awesomely named “draconitic month”, the ~27d period cycle of the orbital nodes (where the Moon’s orbit intersect the Earth’s orbit, thus allowing for a dragon to eat the sun/moon in an eclipse).
It’s the interplay of those two cycles
How it’s actually going?
Uhhhh… So-so.
What’s worked so far
Looking at diagnostics statistics, the data seems correct. The raw list of eclipses matches official ones published by places like NASA. So that’s a relief.
The “eclipses visible from NYC” part seems correct because 50% of eclipses are below the horizon and not visible. Great.
When I calculate the number of days between eclipses and group by them, there’s clearly a basic cluster that implies at least some cyclic behavior. This of course ignores any patterns of of eclipse gaps, but it’s good to know that the data is behavior largely as expected.

When I cheat and look at ALL possible eclipses at the period, the cycle data is MUCH cleaner, as seen below:
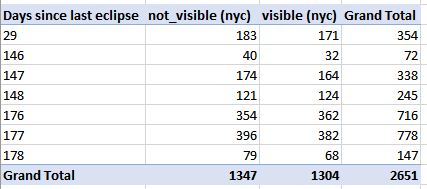
Essentially, lunar eclipses happen either 29 days, ~147 days, or ~177 days apart, assuming you can see through the Earth. It gets significantly more complex when you have missing data and the gaps can get significantly bigger. The difficulty is you need to predict which is the next gap.
What’s gone horribly wrong already
DATES and TIMES. Oh. My. Gawd.
Know how the Python Epoch starts in Jan 1, 1970? Our data set starts in March 3rd, 1550 (on the Gregorian calendar, if it had been used back then, since it was adopted in the 18th century). It also runs until the year 2640. Pythons modules seem to handle the years fine, but I kept having trouble messing with them to do what I needed.
For example, lunar eclipse data is sparse, one happens at MOST once a month. But if I want to generate a chart and time series of the data, I need to generate and fill in all the empty days properly and that was messier than expected.
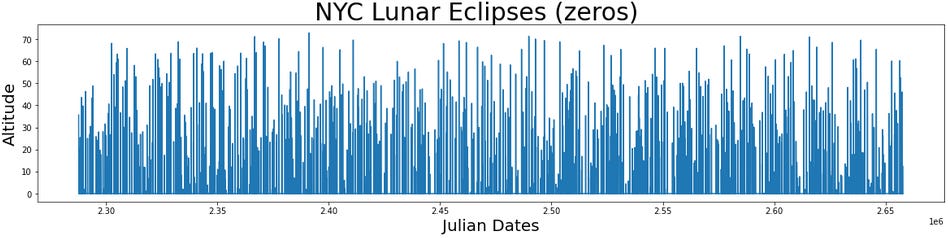
Realizing that the Julian Date system, which just monotonically counts days starting at noon since 4713BC, made life MUCH easier because we don’t have to deal with the calendar, allowing me to quickly generate a zero series.
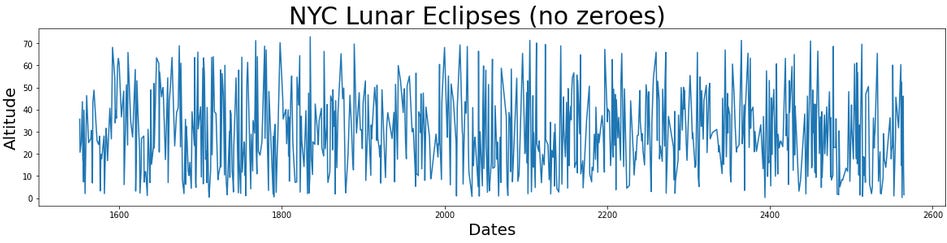
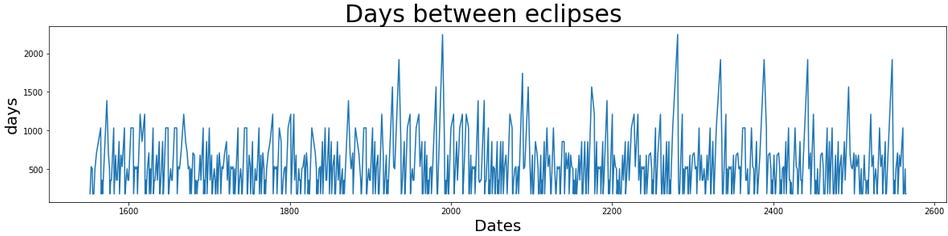
Meanwhile, looking at the plot of the gaps between eclipses is… hyper noisy! It’ll actually prove to be a pretty significant challenge to figure out the pattern between eclipses this way.
This is as far as I’ve gotten
As you can see, I haven’t gotten super far on this fun little project. There’s a lot to try and a lot for me to learn.
I’d like to be able to find some way of figuring out the pattern of lunar eclipses. Then I’d also like to know just how much data would it take to actually figure out the pattern. I highly doubt it takes 1000 years of data, but is 50 years enough? 100? Who knows.
Since I’ll probably be chewing on this problem for a while, and I might get derailed by work, I’m going to share the little bits of code I have to generate the data for this challenge and you can try it yourself for your own location on Earth.
Github: Lunar eclipse generator code
https://github.com/randyau/eclipse_data_analysis
I slapped together a public github repo with a Jupyter notebook to do the work of data generation. It’s really simple stuff.
If you have the standard data sciency packages installed (namely numpy) you only really need to install the Skyfield package off of pip itself to get it working. The code should also run on Google Colab.
You can set the lat/lon/elevation for your own location in the heading block and it’ll generate a similar dataset based on your location. Remember that the definition of “visible” is pretty sketchy but is probably good enough for our purposes.
The code currently uses a ~148mb ephemerides data file that covers the years 1550-2650 and allows the code to work. There’s a few bigger and also smaller files available. The download is free from JPL, which is great, but if you’re somehow paying for bandwidth or storage, beware.
The repo also has copies of my own generated CSV files to save you the trouble of doing it yourself. I’m not sure if the data fields in the output is the most ideal data to use for this project, but it’s a start.
Let me know how it’s working out
I obviously have no idea what I’m doing and where I’m going with this challenge. So if anyone out there is joining me on trying to figure out how to do this, let me know if you figure something out.
Currently I’m trying to learn to use the stumpy package which has some interesting methods for finding similar patterns in time series data. Maybe it’ll help find repeating periods, maybe not. The hard part for me is just learning how to format the data in a way that works.
Where am I going from here?
I’ll take a stab at doing more analysis of the data set assuming I have time (it’ll be a busy couple of weeks at work). I also want to try learning how to use the stumpy package, see if it can be useful in this prediction task.
The next thing I’d like to take a stab at is at least create a solar eclipse data set generator. The tricky part is that there isn’t a built in function to do solar eclipses in Skyfield. You can apparently ask Skyfield “at position P, time T, give me the angular separation of the Sun and Moon in the sky”. If the angle between the Sun and Moon is “small” (I’m not sure exactly how small… both are ~1/2deg wide in the sky so maybe within 1/2deg) then an eclipse is happening…
Then I’d just have to… test every minute of daylight for a thousand years? That seems a bit slow. But it might work.
More References
This page gives a rough overview of the lunar movement cycles that causes eclipses, showing that “eclipse seasons” are of certain length and timing with a spiffy chart. Looking into eclipse seasons will provide further hints at predicting things numerically because it’ll suggest what the patterns of the gaps between eclipses are.
Atlas Obscura has some details on how to predict eclipses
Skyfield — The python package we’re using to do all our celestial calculations without losing our minds trying to learn astronomy
NASA catalog of solar eclipses — for next time… maybe
About this newsletter
I’m Randy Au, currently a quantitative UX researcher, former data analyst, and general-purpose data and tech nerd. The Counting Stuff newsletter is a weekly data/tech blog about the less-than-sexy aspects about data science, UX research and tech. With occasional excursions into other fun topics.
Comments and questions are always welcome, they often give me inspiration for new posts. Tweet me. Always feel free to share these free newsletter posts with others.
All photos/drawings used are taken/created by Randy unless otherwise noted.
Dear Randy, just wanted to say I love all your work and thank you for sharing with us! :)
To find the period of your multiple overlayed signals, why not fourier?