

Research is a team sport, even the analysis bits
Research is a team sport, even the analysis bits
Despite it being our primary job

A bit of a shorter post this week because the toddler brought home a wallop of a cold that’s bulldozed everyone in the house over the weekend.

As a data analyst at heart, people come to me for answers to their questions and that’s what they normally get. But there are definitely times where I have no idea what the heck to do with a research question. Sometimes, the only thing that we can do is just lay out all the messiness as far as we’ve taken it, and see what other people think of it.
For an field that’s often seen as delivering polished models and results, or working on stuff that’s too complicated for others to understand, it’s not something we talk about very much. For people newer to data science, it’s worth talking about more often.

Earlier in the week, I was in the middle of a large group research project for work where a group of researchers and managers were trying to understand how to tackle a certain problem. For obvious reasons, I’m not going into specifics, but the gist of the problem was a variant of “Why do certain users do X, and not Y?”.
Obviously this problem falls under the general heading of “fishing trip” because the answer is going to be “it depends…”. We could blow a huge amount of time and resources searching for an answer and not find anything usable. For this particular instance, we were pretty convinced that there must exist a subset of situations that might be within our control. Our goal is to identify that slice, however tiny it may be, and tell people what to do about it.
The research group was a healthy mix of people. We’ve got access to both quant and qual researchers, as well as people with contacts into other parts of the organization (like marketing, sales, ops, etc.). We were awash in data and information, but we didn’t know what we’re looking for yet.
The state of not having the answer
The problem with fishing expedition projects is that for every action you take, there are no guarantees that there is a payoff on the other side. No matter how much past experience with similar situations and hunches you have, they very often don’t pan out.
After wrangling the source data as much as I can and pulling the counts of things into something cohere, I hit a wall. I had a rough picture describing what various users were doing with the system, but I had no idea how to pull it together into a cohesive story. It was just a bunch of numbers in tables, lines on charts. I couldn’t come up with some fancy slicing, some clustering, nor clever visualization to pull out the “aha!” moment. It was just a pile of customers doing random-seeming customer things.
As someone who’s used to being relied on to having answers at opportune times, even if only partial answers, it’s never comfortable to be in a state of complete ¯\_(ツ)_/¯.
What’s a stuck quant to do?
Why, take the spreadsheet of tables and sparklines to the research group meeting, and we all look at it together! Of course.
Research is a team sport
Usually when we’re stuck in the middle of a research project like this, we’re in need of inspiration. The typical pathways we’ve gone down to approach the problem has proven lacking — it’s time to look outside of ourselves for inspiration.
On the team were a couple of industry veterans, a qual researcher, and other smart people. None of them were quantitative researchers or data scientists, but if I could show them a view what these users were doing in a format that was somewhat digestible, maybe should have ideas on how to use it in their own research efforts.
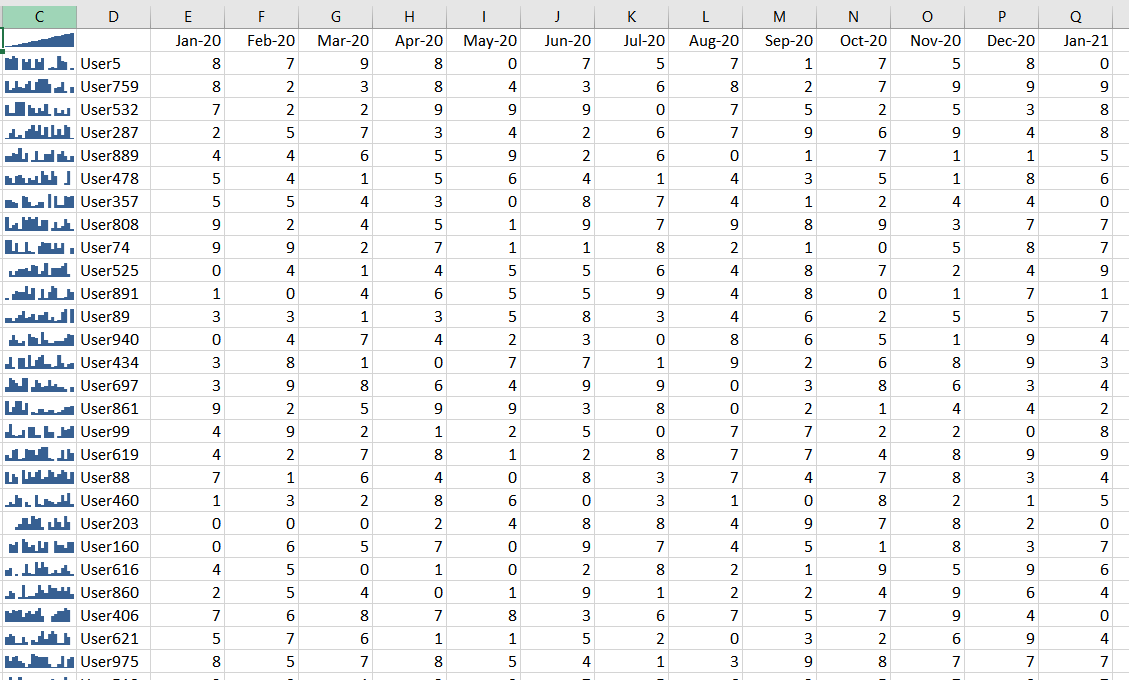
So up onto the screen goes a giant spreadsheet with a grid of numbers and some sparklines, similar to the faked screenshot above. I have to spend a couple of minutes walking through what everything means, but it’s effectively a giant list of time series. I’d open with describing small patterns that I’ve noticed, this user only did these actions so they’ve only got this use case, that user is doing so much more and it’s not clear what they’re up to. Since the limits of quantitative data is describing WHAT is going on, that was all I could do.
From that ugly start, the rest of the team started coming up with ideas. Oh, that user looks interesting and we’ve heard of something similar so we should talk to them. We have no idea what this group even means so let’s dig deeper there with qualitative methods. We’ve heard some stories about this particular use case and know there’s some UX problems in the area so we can reach out to people who’ve helped them to see what’s up.
And thus we managed to generate new hypothesis and focus points for further research. Thanks to the smarts of the rest of the team, the project moved forward. If I spent another week fumbling around trying different slices and visualizations, it could’ve easily been a wasted week of everyone’s time. It’s a reminder that while we might be the only “quantitative” person working on a given team, it does not mean that we have to do everything alone.
For those who have been part of larger research teams and endeavors, this likely comes as no surprise. Researchers absolutely love seeing what other people are working on and offering suggestions. But this works even with people who aren’t researchers. So long as you can make your research comprehensible to them, I’ve found that just about anyone with relevant domain knowledge can offer some useful, surprising insight. And often all it takes is one little random piece of insight to crystalize the whole problem and provide a new direction to move in.
So, never think that you need to know everything all the time. This is true no matter how many years you’ve been doing this. None of us are ever working in a complete vacuum, and we’re all better for it.
Go show some friends you ugly spreadsheets.
About this newsletter
I’m Randy Au, currently a Quantitative UX researcher, former data analyst, and general-purpose data and tech nerd. The Counting Stuff newsletter is a weekly data/tech blog about the less-than-sexy aspects about data science, UX research and tech. With occasional excursions into other fun topics.
All photos/drawings used are taken/created by Randy unless otherwise noted.
Supporting this newsletter:
This newsletter is free, share it with your friends without guilt! But if you like the content and want to send some love, here’s some options:
Tweet me - Comments and questions are always welcome, they often inspire new posts
A small one-time donation at Ko-fi - Thanks to the folks who occasionally send a donation! I see the comments and read each one. I haven’t figured out a polite way of responding yet because distributed systems are hard. But it’s very appreciated!!!