

What's up with Readability formulas?
What's up with Readability formulas?
Are they just wishful thinking?

It has been an extremely busy week for the internet Data community, and is likely to continue to be a headline generating dumpster fire for the next couple of weeks. So I’m going to do my best to NOT write about it here. We’ll pretend it’s a normal autumn day out.
There’ll be a tiny section at the end with some references for anyone in the data community who wants to find other places data communities are hanging out.

Usually, when I finish writing up a post and prepare to publish it, I hop over to wordcounter.net and just paste my text into it to see how many words I’ve spewed onto the page. (Note: I don’t have any affiliation w/ the site nor particularly endorse it. It’s just convenient to plop text in and get a count out.) I largely use the metrics as a safeguard against writing too much in a single post.
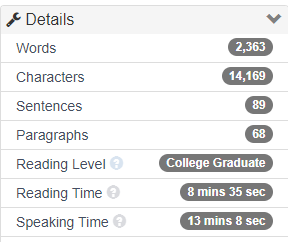
I’ve always wondered about that “Reading level” metric. In my personal experience, it always reads something high like “College” because whatever quirks and patterns exist in my writing inevitably lands on that end of the difficulty scale for most readability formulae.
But… what ARE these things anyways? Why were they created and how do they even work?
The core motivation for readability formulae (of which there are many) is a simple observation that almost anyone can arrive at — some texts are easy to read, some are hard, and that difficulty is related to various properties of the text. What are the things that affect how difficult people perceive a given text and is there a way we can quickly figure out the difficulty of a text?
It’s a very familiar pattern of questioning to data scientists — can we build a metric and measurement method around this “readability” thing? It feels like we might be able to because we have an intuition that there are somewhat objective things that could be counted that should correlate with reading difficulty. For example, a text that uses lots of really big, difficult/specialized words in complex sentences, like an academic medical paper, is going to be easier than a children’s book that uses short simple words in short declarative sentences.
These ideas surrounding readability and metrics must have occurred to many people over the years. One of the first publications about it seems to date to 1893 when L.A. Sherman published The Analytics of Literature. Sherman applied statistics to texts, counting the average number of words in a sentence and showing how the average sentence length had gone down from Elizabethan and Victorian times into the 1900s. Sherman also showed that sampling texts was a viable method of measuring these parameters, which meant no one had to count features for an entire book.
From there, the notion of coming up with some measure of readability became increasingly useful. Educators wanted to make sure that the textbooks were readable to their audience. Publications wanted to make sure their publications were readable because it meant more sales. The government wanted to make sure their manuals and guides were readable, both in the military and civil service. This was especially relevant with the first World War in recent memory and the second raging on at the time. Literacy advocates wanted to know if the growing number of literate adults in the early 1900s had access to materials that were both interesting and understandable.
Against this backdrop, there were many different readability formulae proposed and developed over the years. Today I’ll just take a look at two that have stood the test of time: The Flesch reading ease formula, which primarily correlates syllable counts and sentence lengths, and the Dale-Chall formula, which focuses on word difficulty and sentence length, since they’re fairly popular and well-known.
Like with all metrics, people found readability metrics useful for their own private, selfish purposes. Publications found that writing at a more readable level increased sales. The military generally wanted their training materials distributed to soldiers and staff to be easy to read. You very quickly get into Goodhart’s Law where now you have editors and administrators actively trying to get writers to meet certain readability criteria in the name of ulterior motives. Since the formulae emphasized various things to different degrees like sentence length or word choice, you’d see distortions come from gaming the system.
When people hear about readability formulae and have the gut reaction that the formulae are a bad idea, they’re very likely thinking about those pathological cases where people are being asked to write “to a formula”. Such demands obviously introduce distortions into normal writing that can just as easily hurt the true readability of a text without causing issues in a mechanical formula.
But enough rambling upon what people were doing with these formulae, let’s see what they’re made of.
The Flesch reading ease formula
Perhaps the most used of all readability formula was created by Flesch, who authored multiple readability formulae over the years. His approach relied on statistical analysis of certain measured properties of text samples and used regression to predict the grade level of McCall-Crabb’s Standardized reading tests.
Here’s his own description of how the formula prior to the current Flesch readability formula was developed. That particular formula had found widespread use in places, which prompted him to make some revisions.
The criterion used in the original formula was McCall-Crabbs' Standard test lessons in reading. The formula was so constructed that it predicted the average grade level of a child who could answer correctly three-quarters of the test questions asked about a given passage. Its multiple correlation coefficient was R = .74.
Noting that while using a reading test made for children wasn’t ideal for measuring adult readability, he also admits that there doesn’t exist a comparable data set for grading adult reading ability. So Flesch reuses the McCall-Crabbs tests for his newer formula published in 1948. The basic idea involved taking the passages used in the tests (since they had been carefully graded), analyzing them by sentence and word length according to the proposed formula algorithm, then using regression to generate a scoring scale to predict those grade levels.
Reading Ease = 206.835 - .846 wl - 1.015 sl
wl = word length = average syllables per word
sl = sentence length = avg words per sentence
Flesch also published a second formula for “Human Interest” that has largely fallen to the wayside:
Human Interest = 3.635 pw + .314 ps
pw = personal words = avg number of “All nouns with natural gender; all pronouns except neuter pronouns; and the words people (used with the plural verb) and folks.”
ps = personal sentences = avg number of “Spoken sentences, marked by quotation marks or otherwise; questions, commands, requests, and other sentences directly addressed to the reader; exclamations; and grammatically incomplete sentences whose meaning has to be inferred from the context.”
Human interest was apparently a way to measure the extent that they were supposed to interest the reader, like as if the text was speaking to them. It appeared they thought it would have an affect on the desirability of the text? I’m not completely sure where they were going with it, but we don’t really use that piece.
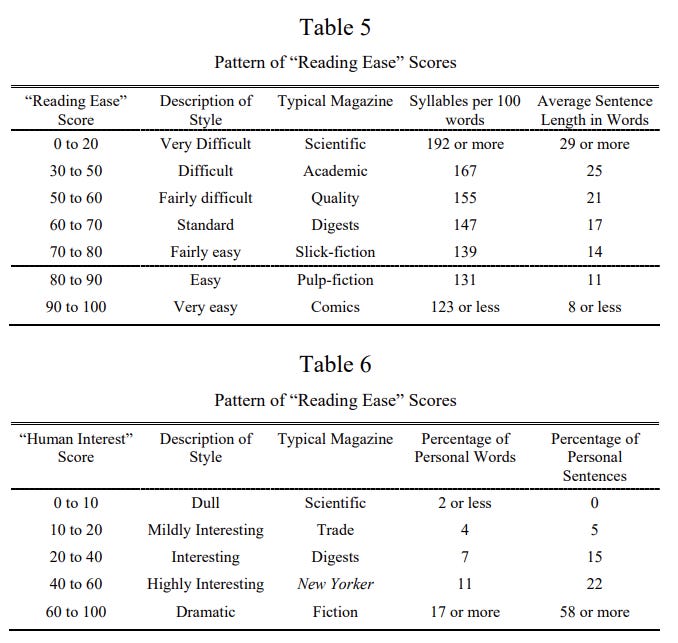
The scores were interpreted with this table:
Later, Flesch would cooperate with Kincaid to create the “Flesch-Kincaid grade level” formula, which is effectively the same methodology of using regression to target a reading test data set, but the scoring and regression coefficients were changed so that the results would largely align with school grade level.
Grade Level = 0.39 sl + 11.8 wl - 15.59
sl = sentence length = avg words per sentence
wl = word length = average syllables per word
As data scientists, we’re probably most surprised that the whole thing is just a count of sentences and syllables thrown into a regression against a standardized reading test. The McCall-Crabbs materials used were completely out of convenience as far as I can tell. It’s a fairly large corpus of text that had been deemed appropriate for specific school grades. The sentence and syllable parameters themselves seem picked because they not only had predictive power, but also because they were relatively easy to calculate by hand in the days before computers. In terms of epistemological ground, the whole readability formula rests on pretty sketchy territory.
Even more interesting to me is that you can still buy copies of the McCall-Crabbs reading tests today and some teachers might actually use them to test the reading ability of kids. I’m not versed in English pedagogy so I don’t know the answer, but I wonder whether the tests have changed over the past 100 years. Has language continued to get simpler, and now there’s inherent grade level drift? Did changes in curricula over the decades completely change how we think about grade-appropriate level reading while these formula have been forever set in stone? It doesn’t appear to be the case, but I honestly haven’t found any reference saying one way or the other.
The Dale–Chall formula
The Dale-Chall formula ALSO dates to the 1940s of Flesch’s readability ease formula. In fact, both were part of the large academic conversation around readability at the time and each one referenced, critiqued, and built upon the work of everyone else.
The core measurement of Dale-Chall is fundamentally different than Flesch. Instead of counting the length of sentences and the number of syllables, Dale-Chall relies upon a word list of “familiar words”. It focuses on the notion of “vocabulary load”, that is, difficult words are a primary driver in the difficulty of a text, perhaps even more so than the length and complexity of the sentences themselves.
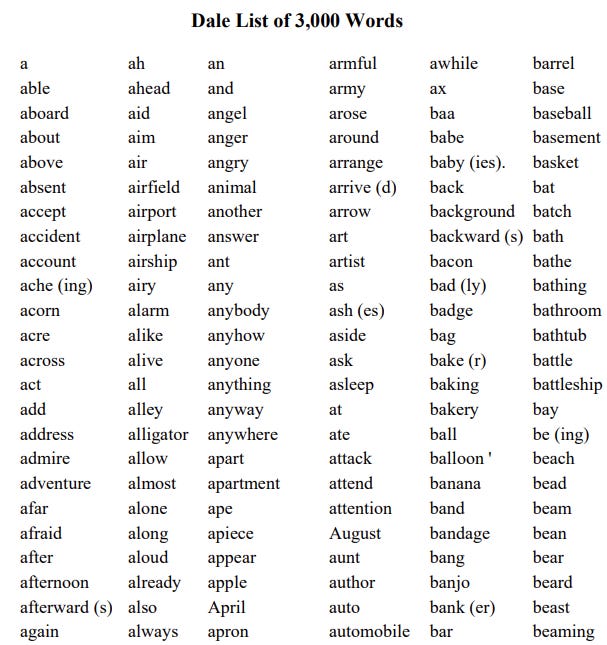
Edgar Dale developed a list of 3000 words that had tested against a group of fourth graders. The criteria was that 80% of fourth grade students should recognize the word for it to be deemed “familiar”. The methodology for the readability formula was then to go through a text and count how many words were NOT on the easy list. The percentage of words would then be put into a formula to derive a readability score.
Despite being based on a 3000 word “familiar word” list, the method is not as simple as merely doing a dictionary search. There’s a set procedure for how to count various words and it’s a complex mess!
- Proper names, places, initials count as one word
- Plurals and possessives of words on the 'familiar' list are considered 'familiar'
- Irregular plurals off familiar words (e.g. oxen for ox) are NOT counted as 'familiar'
- words with '-er' like "burner" are considered "unfamiliar" unless explicitly on the list
- All Proper names of people and places are considered 'familiar'
- For organization names (e.g. World Health Organization) the words are treated separately. BUT if it's used multiple times in the 100-word sample it will only contribute a max of two times to the unfamiliar count
- Abbreviations count as one word. These ALSO have a max unfamiliarity count of 2 if it is repeated in a text.
- Verb conjugations are considered familiar if the base verb is in the list (e,g. "ask" also implies "asking" "asked" "asks" etc)
- Comparatives/Superlatives of adjectives for familiar words are considered familiar (e.g. long, longer, longest)
- Adjectives made by proper nouns (e.g. American) are considered familiar
- Adjectives made by adding -y are 'unfamiliar' unless on the list
- Adverbs made by adding -ly to a familiar word count as familiar
- Adverbs that add more than -ly (e.g. easily) are considered unfamiliar
- Hyphenated words are unfamiliar unless BOTH words are familiar
- Words with -en added (e.g. golden) are unfamiliar unless on the list
- Words with multiple suffixes attached like 'clippings' are considered unfamiliar
- Other suffixes like -ment, -ation, -tion, are unfamiliar unless explicitly on the list
- Numbers are considered familiar
What’s very interesting is that once the word list was developed and the myriad of counting rules laid out, the authors did… exactly what Flesch wound up doing — take their measurements against the McCall-Crabbs reading tests and use regression to arrive at the same grade scores because everyone at the time agreed that there didn’t seem to be a viable alternative.
Did we learn anything?
Sorta, but surprisingly not much. The formulae are all just regressions that tune certain predictive factors against a reading test from a hundred years ago. While it seems that later studies did show that either of the formulae do track reasonably well against the comprehension of readers are various skill levels, they’re ridiculously rough models of what is obviously a complex topic. This gives lots of latitude for the many papers that pop up over time that essentially say “These readability formulae are old and don’t really measure The Real Thing”. It’s completely fair criticism of the things.
But at the same time, both formulae have survived and continue to be used today because some people find them useful enough. If you’re aiming to have a text be largely understandable to a broad audience, aiming for a higher readability score is going to generally put you in the right direction, even if the specific details of how to get there are distorted by the models. This remains true even when the English that these formulae were based on, in the early/mid 1900s, probably slightly differs from the modern English we use today due to pure linguistic shift.
There are plenty of other readability formulae that had been developed over the years, including some new ones that try to include fancy AI/ML methods to address the perceived flaws of the older formulae. But none really have overtaken the classics in terms of widespread use and utility.
If anything, if you’re ever concerned that your work/model/code might not be “good enough” for a task, just remember that there’s these arbitrary regressions that exist and are still being used in practice almost a century later with no revisions.
References
While researching this topic and trying to dig up the old (surprisingly short) papers, I stumbled upon this compilation, The Classic Readability Studies by William H. DuBay. The full text PDF is available and it covers the most important stuff in the early history of the topic. Very convenient and worth a peruse.
If you’re looking to connect with Data Twitter
I’ve been sharing around some crowdsourced spreadsheets (because of course data people would organize themselves via spreadsheet). Please reference them and feel free to contribute to them.
A list of data hangouts - Mostly Slack and Discord servers where data folk hang out
A crowdsourced list of Mastodon accounts of Data Twitter folk - it’s a big list of accounts that people have contributed to of data folk who are now on Mastodon that you can import and auto-follow to reboot your timeline. There’s over 250 entries on there, and covers a lot of familiar faces. I’m fairly sure we have a critical mass now that we’ll be fine even if the bird site completely disappears.
Standing offer: If you created something and would like me to review or share it w/ the data community — my mailbox and Twitter DMs are open.
New thing: I’m also considering occasionally hosting guests posts written by other people. If you’re interested in writing something a data-related post to either show off work, share an experience, or need help coming up with a topic, please contact me.
About this newsletter
I’m Randy Au, Quantitative UX researcher, former data analyst, and general-purpose data and tech nerd. Counting Stuff is a weekly newsletter about the less-than-sexy aspects of data science, UX research and tech. With some excursions into other fun topics.
All photos/drawings used are taken/created by Randy unless otherwise credited.
randyau.com — Curated archive of evergreen posts.
Approaching Significance Discord —where data folk hang out and can talk a bit about data, and a bit about everything else. Randy moderates the discord.
Support the newsletter:
This newsletter is free and will continue to stay that way every Tuesday, share it with your friends without guilt! But if you like the content and want to send some love, here’s some options:
Share posts with other people
Consider a paid Substack subscription or a small one-time Ko-fi donation
Tweet me with comments and questions
Get merch! If shirts and stickers are more your style — There’s a survivorship bias shirt!
I really like the ending thought on "good enough". Trying to develop a model and verify it, the "good enough" point is crucial to know when to stop. As a physicist, I would add one more thing. It is really good if a model can contain at least some "physics" in addition to statistics. In the reading case that would be tying the model to theories of cognition. I made many models where the physics provided some basic constraints on the functional form, while statistics on actual data filled in the detailed calibration. I really preferred hybrid models of that sort. Especially when the model is used for the dangerous task of extrapolation.