

When your product's like a tax form
When your product's like a tax form
It's about as weird as it sounds

Attention: As of January 2024, We have moved to counting-stuff.com. Subscribe there, not here on Substack, if you want to receive weekly posts.
Tickets for Quant UX Con 2023 is available now! It’s scheduled to run from June 14-15, in a multi-track 34 (not a typo) hour marathon that follows the sun. I think it’s borderline madness. Early tickets are $25 ($35 after May 14), but there is a no-questions-asked free Scholarship option. Last year was great (proceedings here) and this year should be even better.

The American tax collection system is famous for being a giant shitshow of complicated filing rules, much of which is perpetuated by companies who sell tax preparation software and services lobbing against a more simplified system. For people who only have a single employer with no other sources of income, it’s entirely possible for the government to send a “we think your taxes this year is $XYZ, please add adjustments we don’t know about” type of form. But instead of this, everyone gets to submit forms of varying complexity, reporting all the details that were already sent to the government by businesses, plus any extra details about their personal situation.
You can see the effects of some of this burden based on how Paperwork Reduction Act requires government agencies to assess the impact of government bureaucracy on citizens. If you look at the instructions for most IRS forms, you can see some kind of disclosure about the burden that form generates. The screenshot below is from the instructions for Form 1040, the primary form for individuals/households to report their income tax to the federal government. It’s the basic form most people have to deal with.
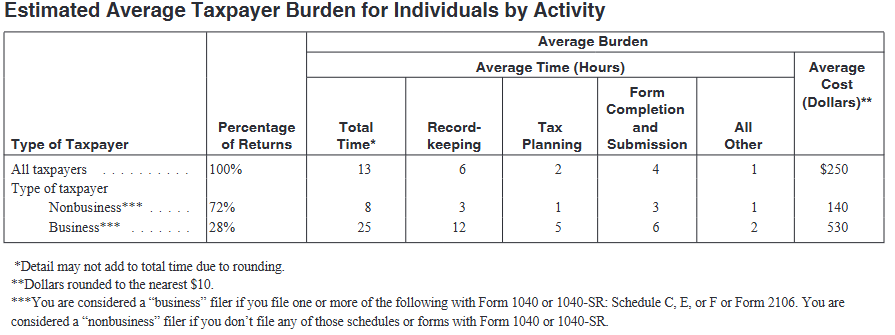
According to the disclosure, the government has determined through studies that the average person would take 13 hours for people to prepare Form 1040. That number includes work like the recordkeeping needed to support and prepare for filling out the form and not just filling out the form directly. Multiply that by the estimated 131 million households in the US that have to file this form, and we’re talking 1.7 BILLION hours spent working on this one tax form per year.
But we all put up with it and file our taxes because if we don’t, we’re facing all sorts of punishment and fines. We all moan and groan about it, and often pay accountants or buy software to do the work for us while cursing the lobbyists who influence lawmakers into avoiding getting rid of this crappy situation via legislation. But we nevertheless do it. We’re captives in such a system.
Maybe your product is like a tax form
I’ve worked on a wide away of products over the years, some were decidedly consumer focused, like clothing e-commerce, while others were decidedly enterprise focused. These days I’ve been working on the usability of cloud infrastructure products, which leans heavily towards the enterprise side of things.
Yes, there are many hobbyists, students, startups, and small businesses who have unique needs for cloud infrastructure. For example, they might not be on the same technological savviness level as a dedicated full time engineer. But by and large, it’s the big mega-corps that are throwing the $100 million+ contracts around that get their specialized needs heard by executives.
Doing usability research type work for enterprise products is a very different universe than consumer products. It is a semi-captive audience where you are essentially creating tax forms for people to fill out. Many of the people using your product are using it solely to complete their jobs. Many don’t have any say in what they use. Think about how you were told to use Slack or MS Teams or some other chat service at work, regardless of whether you hate that piece of software or not. The vast majority of people don’t have the luxury of picking what infrastructure their workplace lets them use.
This means that a lot of the typical research tools we use to measure how much people like our stuff don’t really work quite the way we expect.
For example, in a consumer product, one fundamental metric is a simple “what percent of people who started an action complete it?”. There’s a pretty strong correlation between the friction a user experiences and whether they’ll give up on trying to use a product and you can analyze the whole thing as a kind of funnel/filtering process. Every step that requires the user to stop and read a manual, or fill out a form, or pull out a credit card, is typically going to wind up showing that a percentage of potential users are going to decide the promised payoff isn’t worth their trouble. It’s largely a function of their internal motivation to overcome any friction or doubts they have about your offering.
Meanwhile, in an enterprise product or any other product with a captive audience like tax forms, users have a lot of motivation imposed upon them externally. Finish this thing or potentially lose your job or get a big fine from the government. While that doesn’t mean users are willing to face infinite levels of friction, their tolerance is significantly higher. I just think of all the times I forced myself to work with a chaotic JIRA interface in my previous positions. If things get too painful, again like with taxes, entities will appear that make things easier for users for a fee.
Such a situation means that a simple metric very likely isn’t going to tell the whole story. Because user intent and behavior are somewhat disconnected, the direct measurement tools we’re used to employing take a lot of extra assumption checking to figure out a reasonable interpretation. You’ll probably have to look at alternative, harder-to-analyze measures because users are, in a bizarre way, lying to you through their actions.
For example, you might need to look at how long people take at certain steps, or the number of times they have to look up documentation, or number of attempts before they finally succeed before we can gauge how “difficult” a form actually is — despite most people eventually finishing the task. Very often such measurements are noisy, long-tail distributions that require arbitrary finessing. They don’t give a very clean idea of what is going on, so in the end you might have to do it the hard (expensive) way of actually talking to individual users and observing their behavior directly.
As a quantitative-leaning researcher, I have a great level of tolerance towards trying to tease out usable patterns in a giant sea of log files, but even I have to admit that it’s a giant fishing project with no guarantee that there’s a payoff at the end. It’s not that we don’t have any tools for this situation, but they only function after a lot of simplifying assumptions, guesses, and dead ends. It’s not something you can do on a short turnaround.
Qualitative methods, surveys, and small sample tests in lab situations are often all viable tools that are probably more suited to the task, and all of those takes a ton of time to set up and execute. It’s not something you can do retroactively like with logs and databases. If your hypothesis changes, or you have new questions, you have to repeat much of that work.
At the end of the day, it’s not the tools but the application
It’s something of a relief that the tools needed to work in such situations aren’t all that new. We’re still defining metrics, counting things, measuring differences and changes. The key difference is that we can’t just naively apply the most basic tools and expect a useful answer.
More thought has to go into figuring out whether our measurements are actually valid proxies for the thing we truly want to measure, like user interest and intent. While we can often get away with a fair amount of handwaving for a consumer product, sometimes you really do have to pull out that causal inference model and map out confounding variables and interactions. We as the data folk have to be prepared to step up the level of rigor as the need arises.
Still, despite all the hiccups and challenges, I enjoy the challenge of working on enterprise software. Such software likely won’t ever reach a billion users and be household names, but it doesn’t mean that crappy products aren’t generating real pain and consequences for tons of users. Work software doesn’t HAVE to look and feel like a sad Visual Basic calculator from an insurance company, nor does it have to remind you of your yearly taxes.
ometimes… just sometimes… other people realize that this is part of what we do.
If you’re looking to (re)connect with Data Twitter
Please reference these crowdsourced spreadsheets and feel free to contribute to them.
A list of data hangouts - Mostly Slack and Discord servers where data folk hang out
A crowdsourced list of Mastodon accounts of Data Twitter folk - it’s a big list of accounts that people have contributed to of data folk who are now on Mastodon that you can import and auto-follow to reboot your timeline
Standing offer: If you created something and would like me to review or share it w/ the data community — my mailbox and Twitter DMs are open.
Guest posts: If you’re interested in writing something a data-related post to either show off work, share an experience, or need help coming up with a topic, please contact me. You don’t need any special credentials or credibility to do so.
About this newsletter
I’m Randy Au, Quantitative UX researcher, former data analyst, and general-purpose data and tech nerd. Counting Stuff is a weekly newsletter about the less-than-sexy aspects of data science, UX research and tech. With some excursions into other fun topics.
All photos/drawings used are taken/created by Randy unless otherwise credited.
randyau.com — Curated archive of evergreen posts.
Approaching Significance Discord —where data folk hang out and can talk a bit about data, and a bit about everything else. Randy moderates the discord.
Support the newsletter:
This newsletter is free and will continue to stay that way every Tuesday, share it with your friends without guilt! But if you like the content and want to send some love, here’s some options:
Share posts with other people
Consider a paid Substack subscription or a small one-time Ko-fi donation
Tweet me with comments and questions
Get merch! If shirts and stickers are more your style — There’s a survivorship bias shirt!
I used to be a product manager for an internal piece of software. The two best things we did to try to find the pinch points were:
1. I had my staff try to spend 1 day per week at a user site, talking to people or just standing behind them and watching how they used the software. Downside was that this rarely covered the remote sites, but it did add a lot of value. Made users feel better too.
2. We licensed some online software - I forget the name - that allowed users to enter requests and bugs, and to vote on them. We reviewed them each sprint, and set aside some time each sprint to knock out small ones. Gave the developers a lot of leeway in picking out which small ones to do - which pleased them as well. Bigger ones with a lot of votes went into a more formal analysis, and depending on cost might get scheduled.