

Working With Moon Eclipses Part 2
Working With Moon Eclipses Part 2
Failures ahoy!

Another light week because I’ve been busy juggling generalized 2021 shenanigans, with my gamedev conference happening on the 23rd. In hindsight I should have realized that the inauguration was the 20th. Alas =\. I just pray that we can close out the week without any violence or other nasty surprises.

This week is about failure, because learning in public is good for both the learner and any observers. I continue to chip away at the lunar eclipse problem that I started two weeks ago, and it’s proving to be surprisingly challenging for all sorts of funky reasons.
Difficulty Boost #1, I’ve hamstrung our dataset
I didn’t realize how much difficulty I added.
Recall that while we’ve been using Skyfield to generate every possible lunar eclipse for the planet, we created a constraint for our prediction problem to be restricted to our location on Earth. Effectively that cuts away half of the possible lunar eclipses we can observe because the rest happen during local daytime.
We also chose to ignore the penumbral eclipses because those can be hard to notice. Some of the the moon barely darkens, while others might be noticeable to a regular skywatcher.
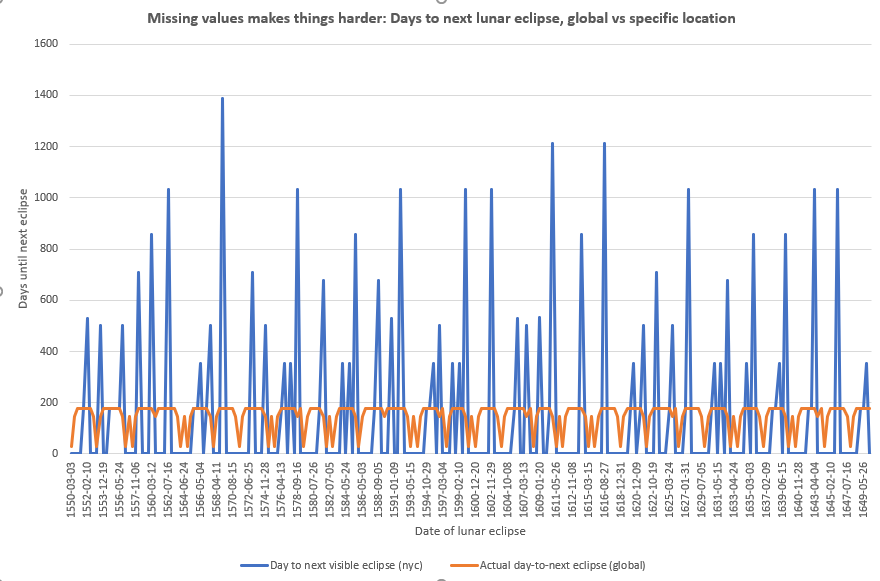
Putting those two constraints together means the dataset is surprisingly sparse and unpredictable. Below is a plot of ~1000 years of eclipses, with the Y-axis being the number of days until the next observed eclipse.
The orange line is if we had perfect knowledge of the universe and could record every single eclipse no matter if it happened during the day or night. Note that it is quite regular. Most eclipses are at most ~170ish days apart, but with some slight irregularity it they pop up in shorter pairs up to a month apart. Usually those short pairs are penumbral eclipses where the moon’s ~29 day lunar cycle (the synodic month) and the ~27 day draconic month where the moon passes the same orbital node (the only time when eclipses can happen).
The blue line is the same “time between eclipses” measurement, but restricted to an observer in NYC who can’t see penumbra eclipses. It’s pretty damn chaotic, with lots of spiles in the 300s, 400s, but some extreme gaps up to 1400 days in length.
And just think, I didn’t even factor in the weather, which according to this, NYC Central Park averages 234 days with at least some sun (64% of the year), so there’s a 36% chance of that a lunar eclipse happening overhead isn’t even visible to be recorded locally.
If anything, this increases my respect for ancient civilizations that figured all this out somehow. They not only had records from their immediate location, but probably observations from other locations to get around issues with weather.
Difficulty Boost #2: Dates… again…
Who would’ve guessed that dates would cause trouble for data science?
Python datetime objects can apparently handle dates starting from AD 1 until AD 9999. This is generally a good thing. We’re going to kindly ignore the fact that the Gregorian calendar that we currently use wasn’t actually adopted in the 1700s, because at the least the calendar seems to behave correctly regardless.
This fact is important to us because our dates stretch from 1550 CE, into 2640 CE. This is obviously prior to the Unix epoch (or most other computer epochs).
In : import datetime as dt

In : dt.date(1,1,1)
Out: datetime.date(1, 1, 1)

In : dt.date(9999,12,31)
Out: datetime.date(9999, 12, 31)
So, imagine my surprise when I was fumbling around pandas trying to work with our dataset, and hit this error: OutOfBoundsDatetime: Out of bounds nanosecond timestamp: 1550-01-01 00:00:00.
Apparently, pandas has its own timestamp data type that’s used to facilitate its time series data indexing functionality. It also features nanosecond precision. But apparently due to this nanosecond precision, it has a lower bound of approximately 1677-09-21 00:13. This seems to be because it’s counting nanoseconds since the Unix Epoch of 1970-01-01 00:00 using a signed 64-bit integer.
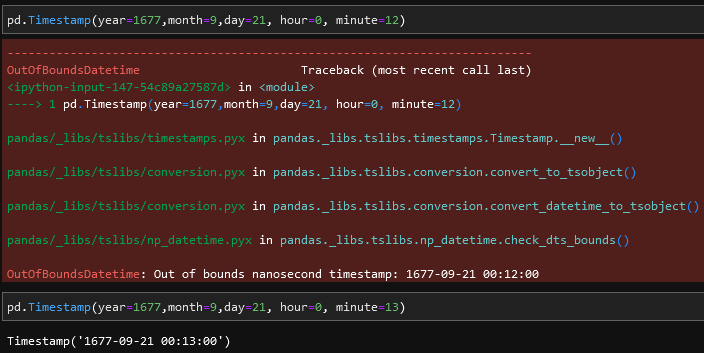
So we’re restricted to how much data we can use to roughly the time period between 1677 and 2262, a period of 585 years.
BUT NO. It doesn’t stop there. IF we restrict our dataset to the absolute widest 585 year boundaries, this happens. When trying to do some math on the dates internally, pandas explodes because it can only handle 32 bits of date differences because that operation is backed by a C long integer… Leaving us roughly 292 years leeway to get work done.
# just attempt to shove the data into fb's Prophet to see what it can/can't do
from fbprophet import Prophet
p = Prophet()
joined['ds']=joined.index
joined['ds'] = joined['ds'].apply(lambda x: x.strftime('%Y-%m-%d'))
joined['y'] = joined['altitude'].apply(lambda x: 1 if x>0 else 0)

model = p.fit(joined[ (joined['ds']>'1678-01-01') &
                     (joined['ds']<'2261-01-01') ].reset_index()[['ds','y']].fillna(0) )

=====
OverflowError: Python int too large to convert to C long

The above exception was the direct cause of the following exception:

OutOfBoundsDatetime
Traceback (most recent call last)
...
OutOfBoundsDatetime: Result is too large for pandas.Timedelta. Convert inputs to datetime.datetime with 'Timestamp.to_pydatetime()' before subtracting.
Difficulty Boost #3: I’m not sure how to model the data
Finding a way to handle time cleanly
Given the chaotic nature of the “visible eclipse” chart. I’m not sure what the best way to represent time in the dataset is yet. I can of course use the calendar, but then any model that I derive would need to also figure out the lunar phase cycle from the data. Even from my human eyes and wetware brain, there doesn’t seem to be any easy pattern in the blue line that I can exploit to confidently predict the next lunar eclipse. And that has a thousand years of data in it, likely more than any civilization has.
So one solution to work around this would be to key all the data to be based off of full moon dates. Maybe there’s a pattern in the full moon/eclipse sequence that the algorithms can discern. But first I need to refactor my data to work this way.
I think the only way to handle this is to just arbitrarily assign integers to observed full moons and then mark each one as being with or without an eclipse that date. Then I’d have to create a function that checks for any given full_moon_number in the future, whether an eclipse prediction is correct or not.
That’s on my TODO list.
Continuous vs Binary variables
I’ve never used Stumpy before, nor have I used Prophet, the two tools that various people have recommended to me to try for this problem. Ostensibly, the tutorials and guides all say to format the data as a simple time series and the packages will do most of the heavy lifting for me.
The problem is that both packages assume richer time series than I have. I’m trying to predict a largely binary value: eclipse_this_full_moon == True. Both packages were designed for continuous response variables.
When I just blindly forced prophet to look at data for a bunch of years in linear time, against binary 1/0 values for “is eclipse vs normal full moon”…. I get this garbage of a plot:
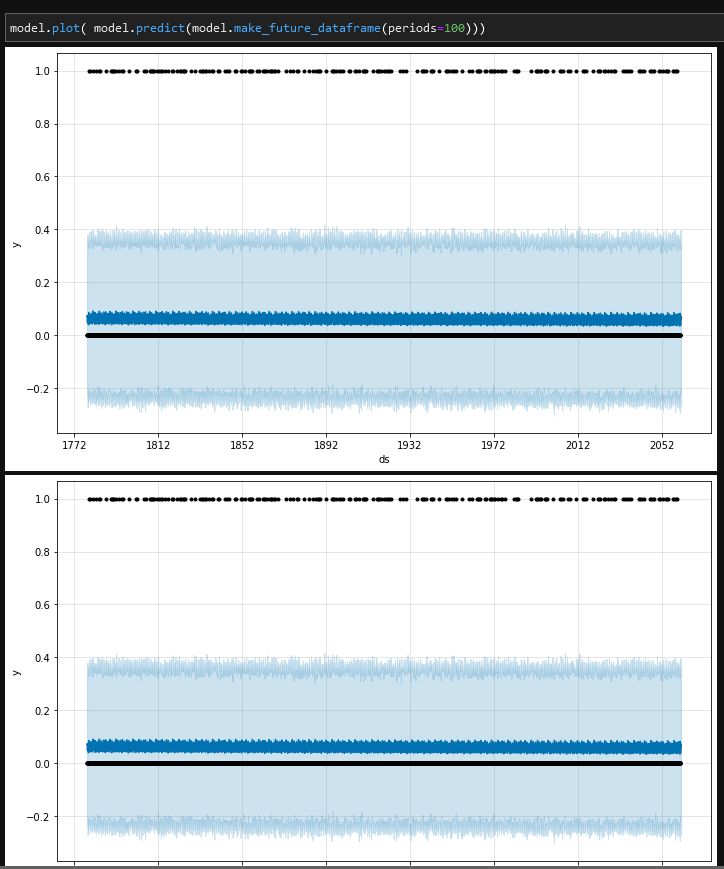
I’m not even sure how to read such a thing to check if it’s any good. It seems to just hover constantly in a state of “Low probability of eclipse” =\. This is where I think the realtime scale is just a hindrance and I need to move to the full-moon integer scale.
We do have access to a continuous variable to try predicting on, altitude, how high in the sky an eclipse will appear. But looking at how chaotic those values are, I’m not sure if it’s particularly useful. The specific altitude of an eclipse depends on the timings of the eclipse cycle and the relative rotation of the Earth. I’m sure there’s some kind of common multiple between the cycles such that you can have full moons appear in the same height in the sky, but it’s probably a very long and messy cycle.
I’ll continue to chip away at this
Crazy distractions from the outside world aside, it’s been pretty fun to chip away at this peculiar problem in the few hours I have of down time each week. Plus, y’all get o watch as I fail in public bashing my head against really weird edge cases.
If anything, I think all the failures are more interesting than any triumphant “Hey, I did the thing!” post. I normally can’t stand reading those unless they include gory details about what went wrong.
About this newsletter
I’m Randy Au, currently a quantitative UX researcher, former data analyst, and general-purpose data and tech nerd. The Counting Stuff newsletter is a weekly data/tech blog about the less-than-sexy aspects about data science, UX research and tech. With occasional excursions into other fun topics.
Comments and questions are always welcome, they often give me inspiration for new posts. Tweet me. Always feel free to share these free newsletter posts with others.
All photos/drawings used are taken/created by Randy unless otherwise noted.